Original Link: https://www.anandtech.com/show/18791/intel-nuc13-pro-arena-canyon-review-raptor-lake-brings-incremental-gains
Intel NUC 13 Pro Arena Canyon Review: Raptor Lake Brings Incremental Gains
by Ganesh T S on March 27, 2023 9:00 AM EST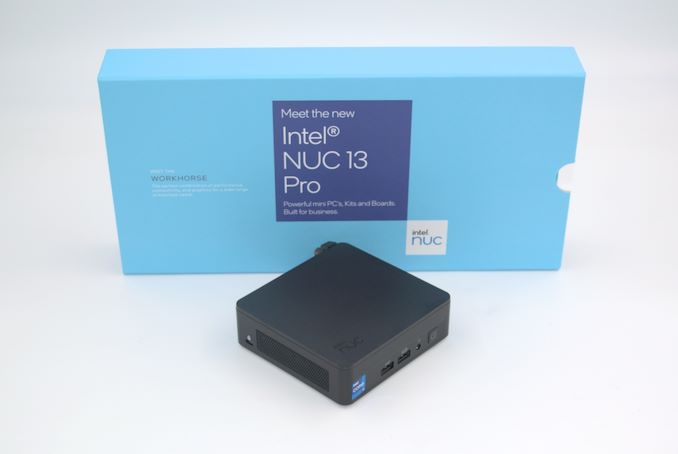
Ultra-compact form-factor PCs have emerged as bright spots in the PC market over the last decade after Intel introduced the NUC. The NUCs started out as replacement for bulky tower desktops in applications where the physical footprint and system capabilities were significantly more than the actual requirements.
The company celebrated the 10-year anniversary of its introduction last year with the introduction of the first UCFF NUC family with hybrid processors. The Alder Lake-based 4"x4" Wall Street Canyon NUCs came with significant improvements over the previous generation in both performance per watt and value proposition metrics. Barely a couple of quarters down the road, Intel is updating its Pro line of UCFF NUCs with the 13th Gen. Core Processors (Raptor Lake). The new Arena Canyon NUCs carry forward the same hardware features of the Wall Street Canyon SKUs, with the primary update being the change in the internal SoC.
Raptor Lake-P brings incremental gains in terms of both performance and power efficiency over Alder Lake-P. We already saw one of Intel's partners - ASRock Industrial - take the lead in delivering UCFF mini-PCs based on Raptor Lake-P. Intel's Arena Canyon NUCs target the same market segment as the ASRock Industrial NUC(S) BOX-13xxP/D4 SKUs. However, Intel is planning to offer a more comprehensive list of processor choices, along with barebones and pre-built options for each.
Intel sampled us with a pre-production version of the NUC13ANKi7 - the slim version of the NUC 13 Pro equipped with a Core i7-1360P processor. This review provides a comprehensive look into the performance profile of the system and how it stacks up against the previous generation as well as other competitors in the market.
Introduction and Product Impressions
Intel's Raptor Lake processors build upon the heterogeneous computing paradigm introduced with hybrid processors in Alder Lake. While the desktop processors enjoyed a few minor microarchitectural tweaks for better performance, the -P series owes its improvements to the maturity of the Intel 7 manufacturing process. The updated voltage-frequency curves have enabled Intel to increase the turbo clocks for both performance and efficiency cores. Some I/O improvements such as additional Thunderbolt 4 ports and USB 3.2 Gen 2x2 support are also in the mix for Raptor Lake-P, but their adoption is dependent on other board component choices.
Intel's Arena Canyon NUCs are visually identical to their Wall Street Canyon counterparts - down to the placement of the I/O ports and the layout of the internal board. In fact, one of the primary reasons for Arena Canyon to get released within a few quarters of the Wall Street Canyon seems to be the similarity in the internal platform. Intel has decided to minimize the changes by going in with the same DDR4 SODIMMs support and Burnside Bridge retimers on the Type-C ports. This means that the Thunderbolt 4 ports in the Arena Canyon NUCs do not support USB 3.2 Gen 2x2 just like the Wall Street Canyon NUCs.
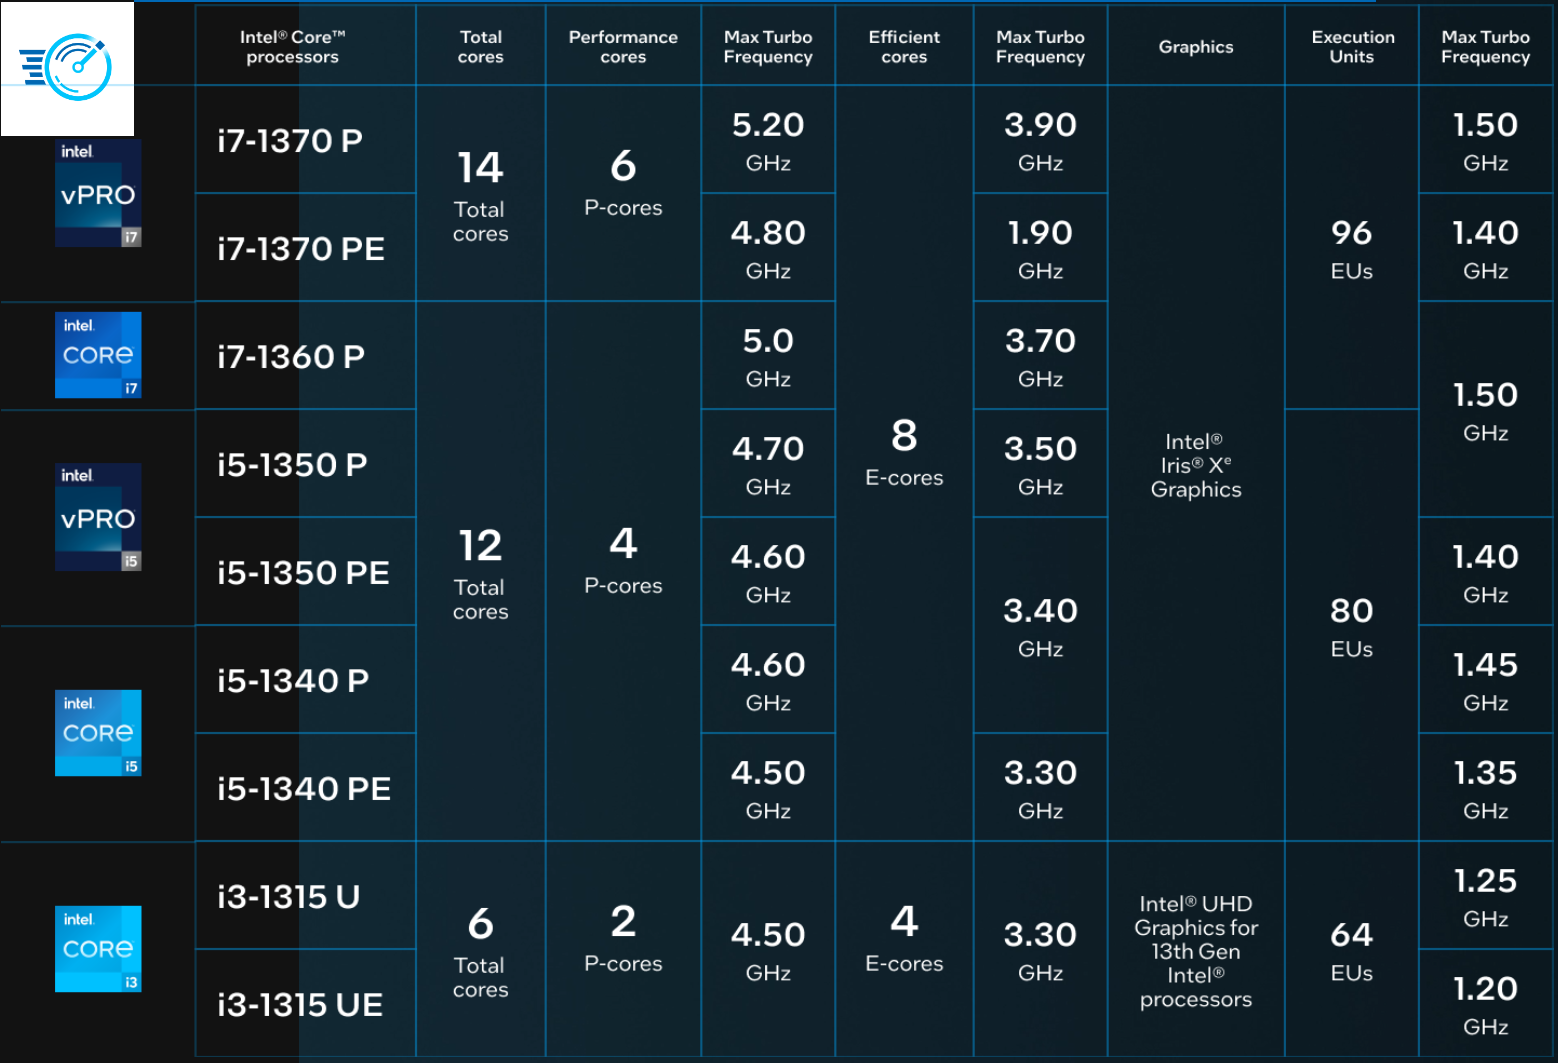
There are some unique SKUs in the Arena Canyon NUC lineup compared to the Wall Street Canyon NUCs, though. There are a couple of models using the special Core i7-1370P and Core i7-1370PE processors (which have a 6P+ 8e configuration not available in Alder Lake-P). Additionally, some SKUs use processors meant for the embedded market. These have a 5-year availability window (compared the 3-year life cycle for the others). Overall, Intel has plans to release around 30 different Arena Canyon NUC SKUs (boards / slim and tall kits / ready-to-use mini-PCs) over the next few quarters.


Intel's lineup of 4"x4" mini-PCs (marketed under the Pro moniker) has evolved to target business use-cases. Keeping that in mind, the company has retained a few SKUs with vPro Enterprise capabilities for easier deployment and management by IT departments. The new vPro systems offer hardware-based remote management with cloud-based manageability, Intel AMT for out-of-band connectivity with KVM support, hardware alarms, and remote power control.
The company is also offering the NUC Pro Software Suite (NPSS) for guaranteeing uptime for digital signage applications. This involves connecting one HDMI port to the primary display and the other HDMI port to another Intel NUC's second HDMI port. By default, both NUCs drive their own primary displays. When the NPSS tool detects heartbeat failure, the operational NUC drives both displays - its own, as well as the failed system's. The tool also includes application monitors to restart unresponsive applications and explicit HDMI-CEC control via diagnostic software.
The compact nature of these systems also lend to usage in IoT and edge computing applications in vehicles, healthcare, industrial, and education domains. From a reliability perspective, Intel is qualifying all the NUC 13 Pro systems for 24x7 operation during the 3-year warranty period. These NUCs come with cutting edge features (for a UCFF system) such as support for the Wi-Fi 6E, Bluetooth 5.3, and four simultaneous 4Kp60 displays. Features such as display emulation also make it friendly for headless operation and digital signage deployments.
On the industrial design front, Intel has decided to (thankfully) go with a matte-textured chassis with an 'intel nuc' logo embedded on top. The ventilation support and thermal design appear to be retained from earlier UCFF NUCs. The top-end SKU based on the Core i7-1370P would have been more interesting to review on account of the additional cores, but the Core i7-1360P model that we are looking at today is essentially a like-for-like replacement for the NUC12WSKi7 that was reviewed in detail earlier this year. The packaging of our pre-production sample is not reflective of the contents of the retail box. The sample came with a 120W (20V @ 6A) power adapter, a cable management screw, and mounting screws.
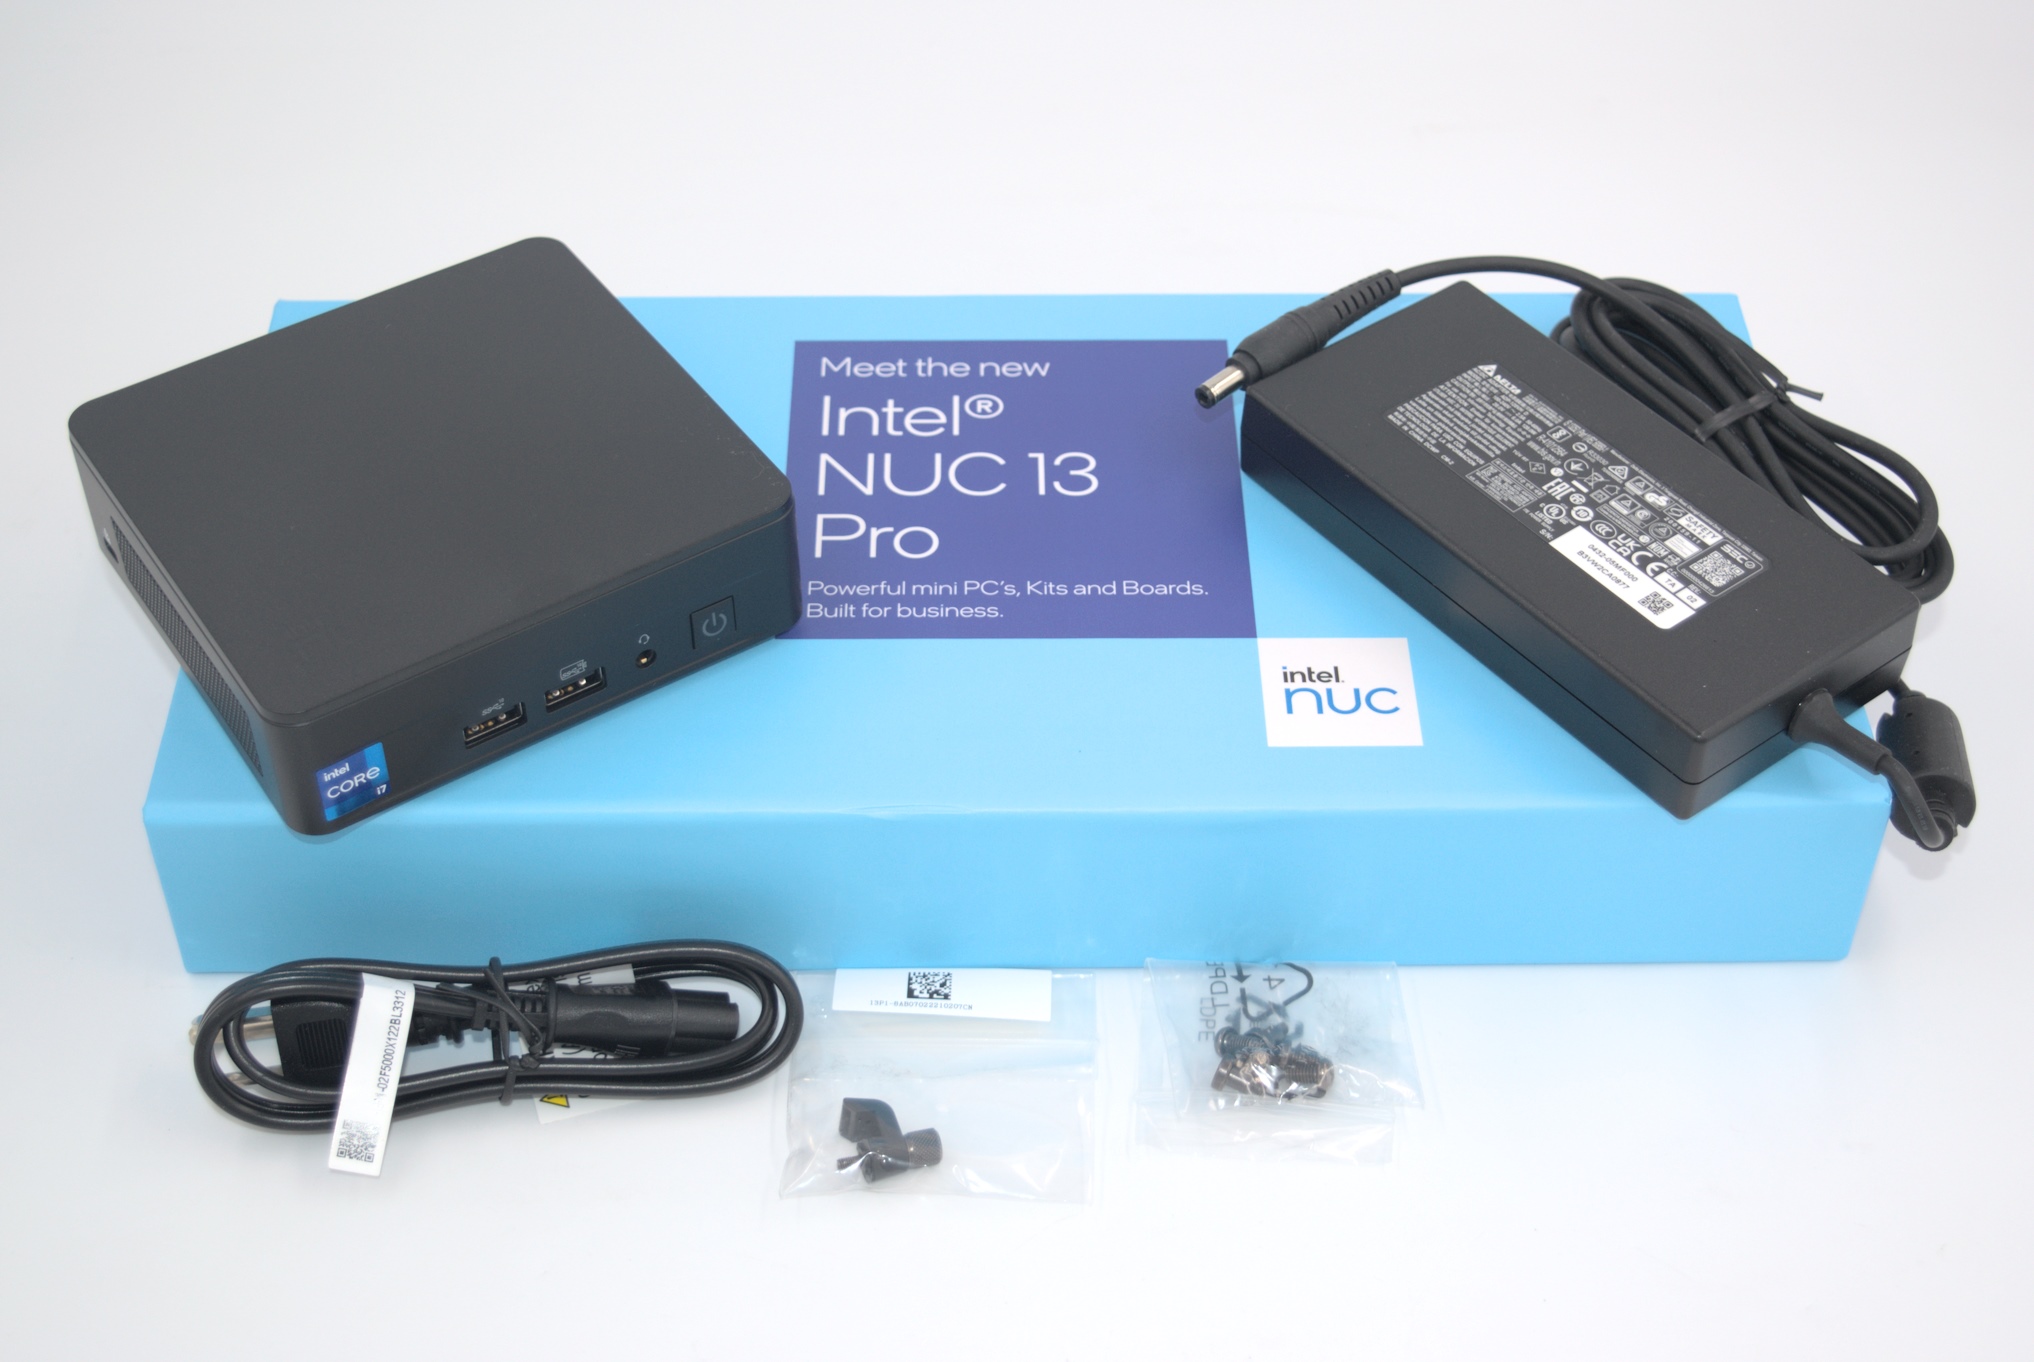
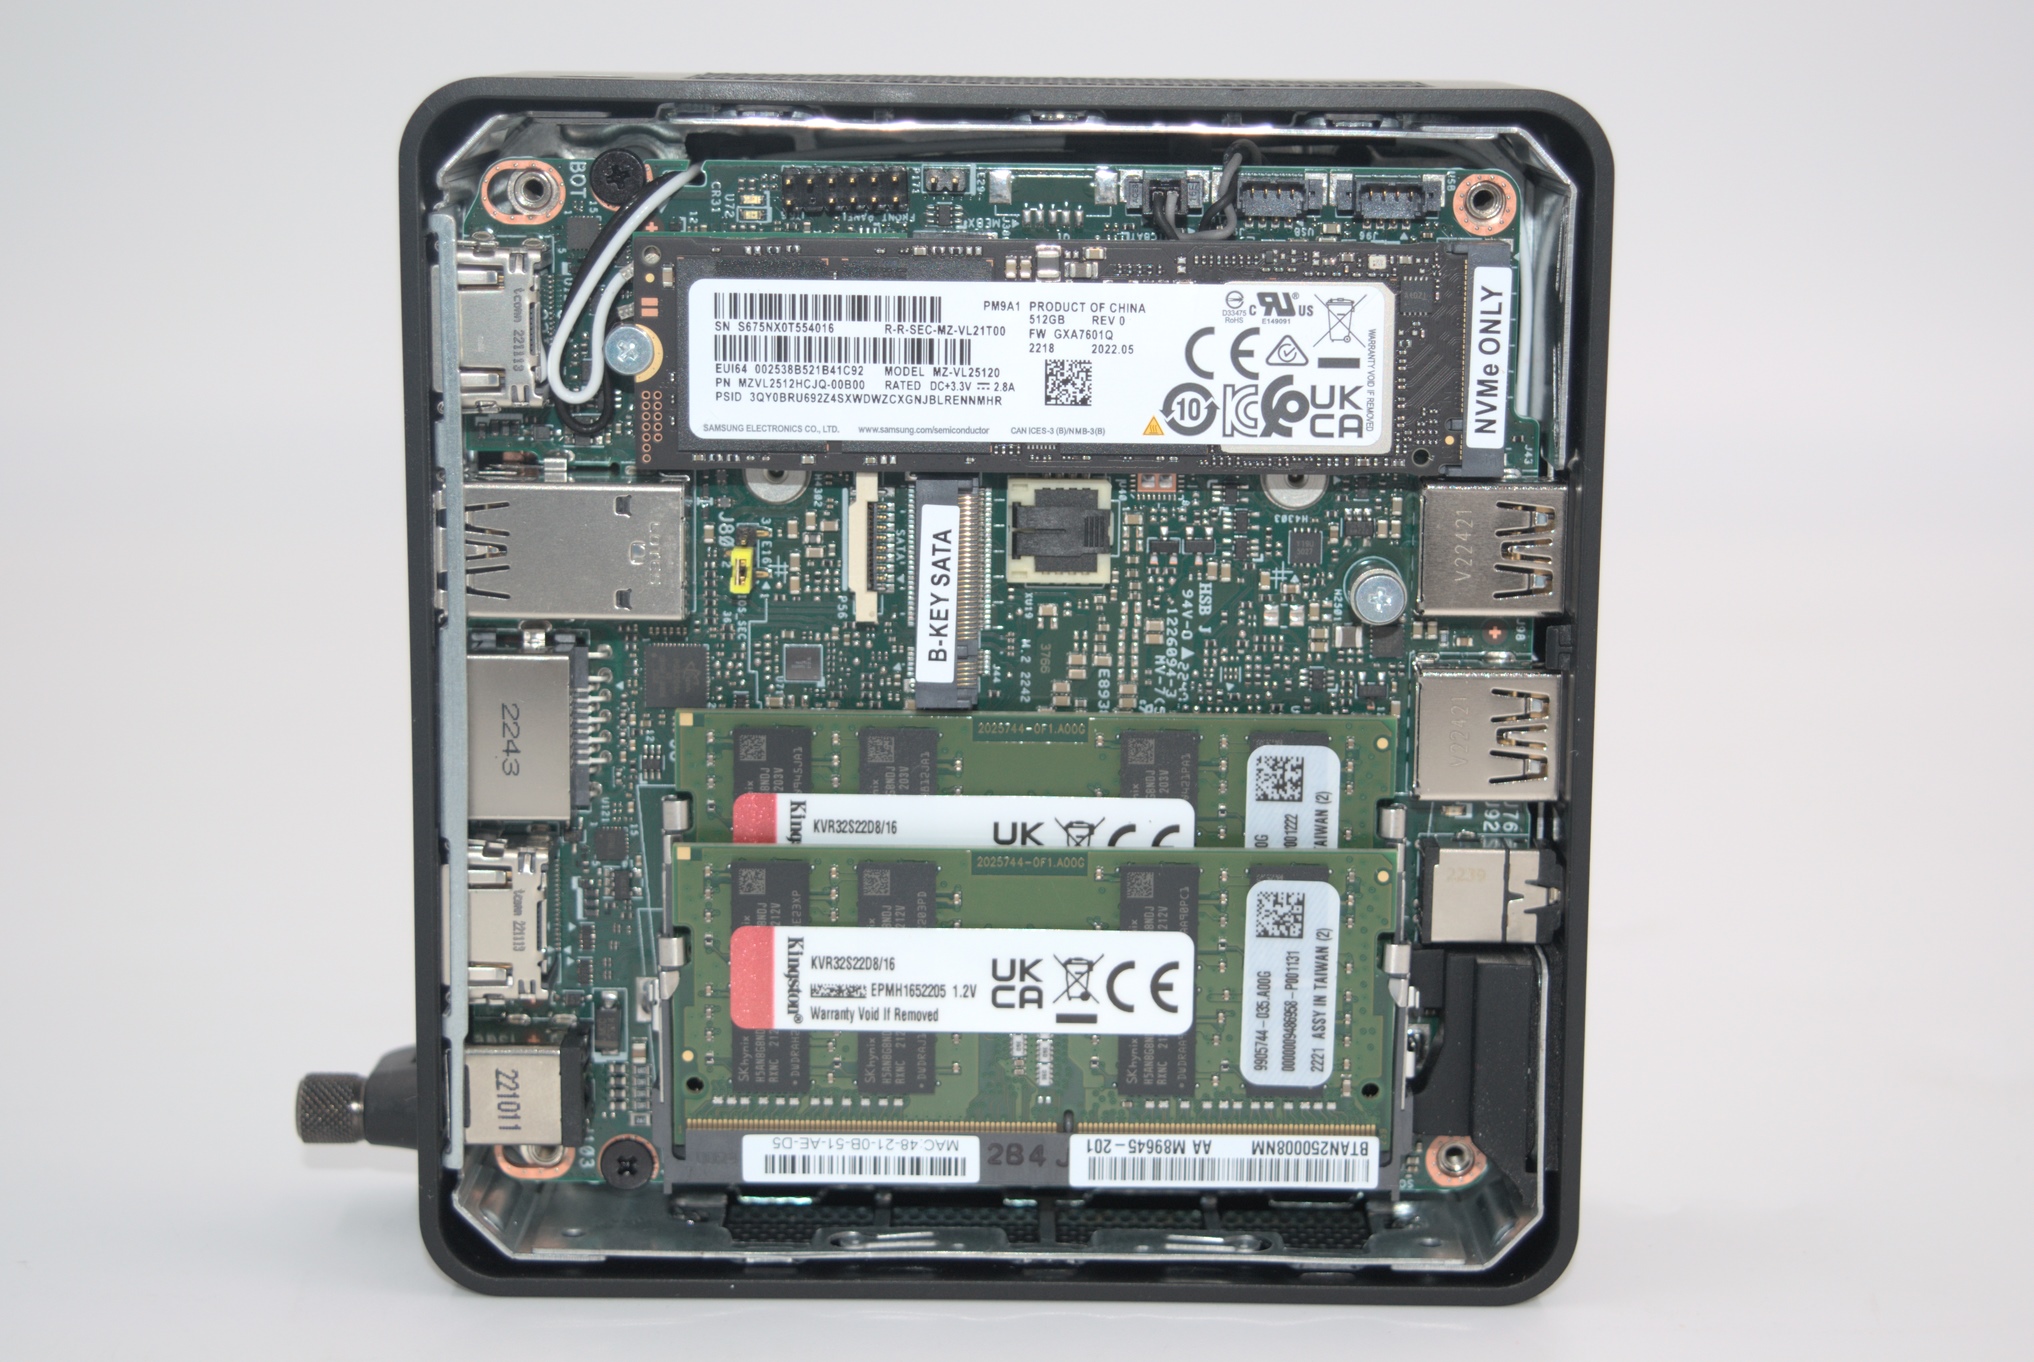
The kit also included a 512 GB PCIe 4.0 x4 NVMe SSD (Samsung PM9A1) and 2x 16 GB DDR-3200 SODIMMs (Kingston ValueRAM).
Windows 11 Home was pre-installed (OEM deployment), but we opted to wipe the disk and install Windows 11 Enterprise 21H2 with the latest updates. In general, moving to Microsoft's latest release (22H2) is fraught with performance issues and unexpected benchmarking behavior. The full specifications of our review sample (as tested) are summarized in the table below.
| Intel NUC13ANKi7 (Arena Canyon) Specifications (as tested) |
|
| Processor | Intel Core i7-1360P Alder Lake 4P + 8e / 16T, up to 5.0 GHz (P) / 3.7 GHz (e) Intel 7, 18MB L2, 35W (PL1 = 40W, PL2 = 64W) |
| Memory | Kingston ValueRAM KVR32S22D8/16 DDR4-3200 SODIMM 22-22-22-52 @ 3200 MHz 2x16 GB |
| Graphics | Intel Iris Xe Graphics (96EU @ 1.50 GHz) |
| Disk Drive(s) | Samsung PM9A1 MZVL2512HCJQ (512 GB; M.2 2280 PCIe 4.0 x4 NVMe;) (Samsung 6th Gen. V-NAND 128L (136T) 3D TLC; Samsung Elpis S4LV003 Controller; OEM version of 980 PRO) |
| Networking | 1x 2.5 GbE RJ-45 (Intel I226-V) Intel Wi-Fi 6 AX211 (2x2 802.11ax - 2.4 Gbps) |
| Audio | Digital Audio with Bitstreaming Support over HDMI Ports 3.5mm stereo headset jack (Realtek audio codec) |
| Video | 2x HDMI 2.1 (4Kp60) 2x Display Port 2.1 with HBR3 over Thunderbolt 4 |
| Miscellaneous I/O Ports | 2x USB 3.2 Gen 2 Type-A (Front) 1x USB 3.2 Gen 2 Type-A (Rear) 1x USB 2.0 Type-A (Rear) 2x Thunderbolt 4 (Rear) (Type-C) |
| Operating System | Windows 11 Enterprise (22000.1696) |
| Pricing | (Street Pricing on March 27th, 2023) US TBD (barebones) $(148 + TBD) (as configured, no OS) |
| Full Specifications | Intel NUC13ANKi7 Specifications |
In the next section, we take a look at the various BIOS options and follow it up with a detailed platform analysis.
Setup Notes and Platform Analysis
Our review sample of the NUC13ANKi7 came with all necessary components pre-installed - we only had to load up the OS to start our evaluation process. Prior to that, we took some time to look into the BIOS interface. The video below presents the entire gamut of available options for the Arena Canyon NUC13ANKi7.
The interface is no different from the earlier NUCs. The most interesting part (that was also in the Wall Street Canyon NUCs) is related to the PL1 and PL2 values. Intel configures these based on the ambient temperature tolerance specified (35C - default, or 40C). Setting the ambient temperature to custom allows independent control of PL1 and PL2. For 35C, the PL1 and PL2 are set at 40W and 64W respectively. Another important point to note is the absence of an 'in-band ECC' option that we saw in the ASRock Industrial NUC BOX-1360P/D4. It is likely that ASRock Industrial will also be removing the option on systems which don't officially support in-band ECC. Given the reliability requirements for business deployments, it would not be a bad idea for Intel to enable the feature that is already present in the silicon for better protection against bit flips in the main memory.
The block diagram below presents the overall high-speed I/O distribution in the Arena Canyon NUC.
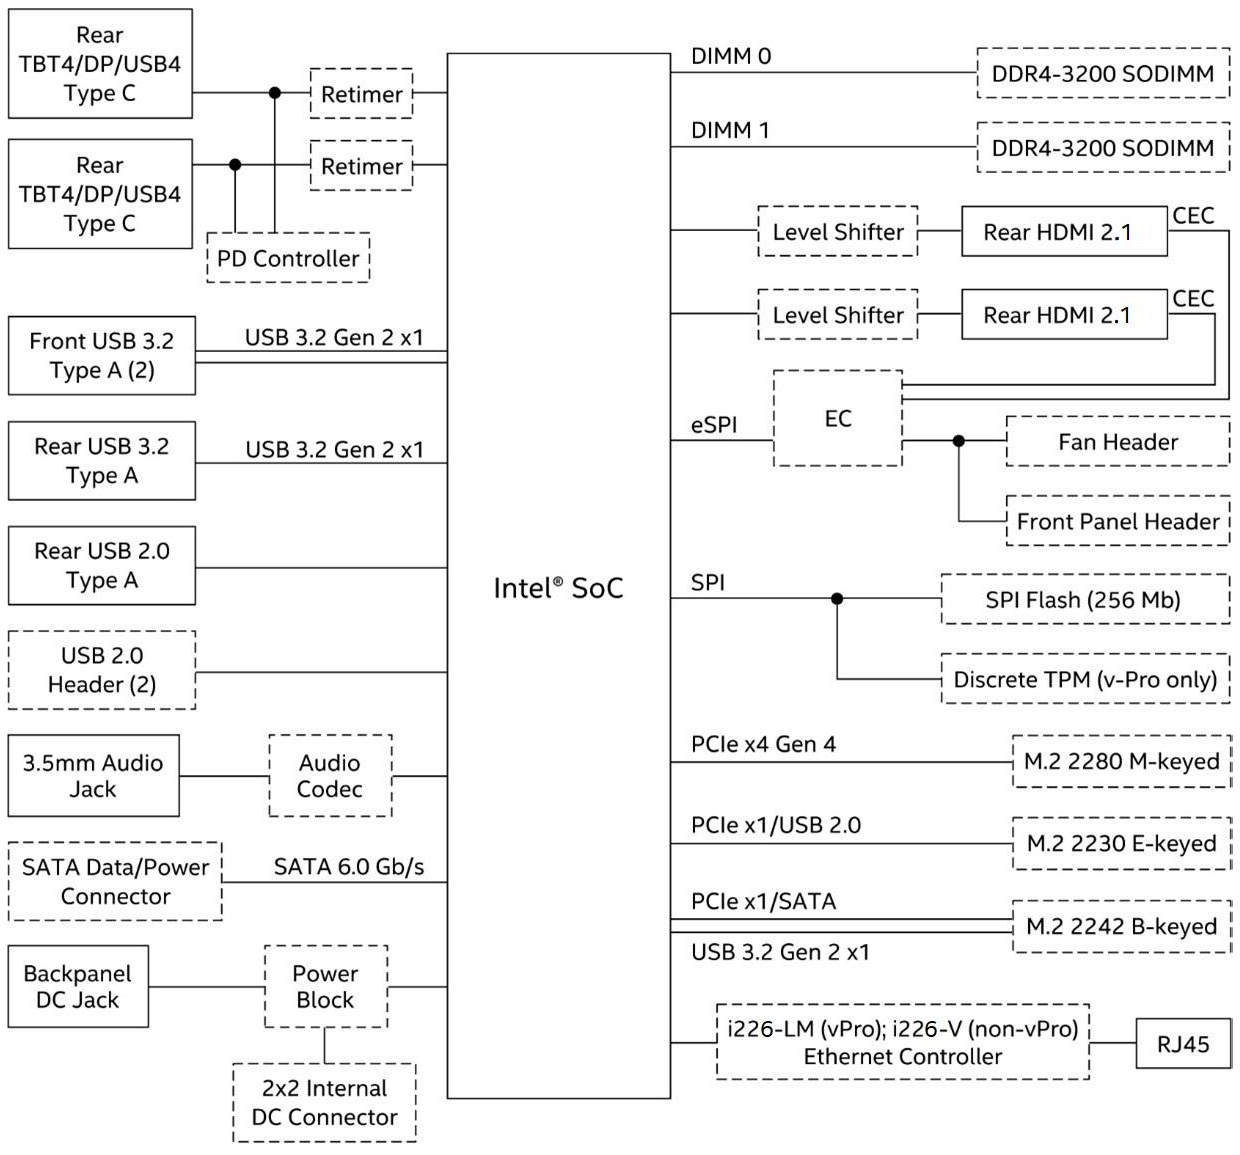
There is a lack of flexibility on the board design side to get creative with the HSIO lanes allocation due to the integration of the PCH inside the package. That said, the diagram above expectedly looks very similar to that of the Wall Street Canyon NUC - the only changes involve the updating of the HDMI port to 2.1 and the change in the Ethernet controller from I225-V to I226-V.
In today's review, we compare the Intel NUC13ANKi7 and a host of other UCFF systems. The systems do not target the same market segments - for example, the Panther Canyon NUC is targeted more towards power users in a home setting. However, many aspects lie in common, making the comparisons relevant.
| Comparative PC Configurations | ||
| Aspect | Intel NUC13ANKi7 (Arena Canyon) | |
| CPU | Intel Core i7-1360P Alder Lake 4P + 8e / 16T, up to 5.0 GHz (P) / 3.7 GHz (e) Intel 7, 18MB L2, 35W (PL1 = 40W, PL2 = 64W) |
Intel Core i7-1360P Alder Lake 4P + 8e / 16T, up to 5.0 GHz (P) / 3.7 GHz (e) Intel 7, 18MB L2, 35W (PL1 = 40W, PL2 = 64W) |
| GPU | Intel Iris Xe Graphics (96EU @ 1.50 GHz) |
Intel Iris Xe Graphics (96EU @ 1.50 GHz) |
| RAM | Kingston ValueRAM KVR32S22D8/16 DDR4-3200 SODIMM 22-22-22-52 @ 3200 MHz 2x16 GB |
Kingston ValueRAM KVR32S22D8/16 DDR4-3200 SODIMM 22-22-22-52 @ 3200 MHz 2x16 GB |
| Storage | Samsung PM9A1 MZVL2512HCJQ (512 GB; M.2 2280 PCIe 4.0 x4 NVMe;) (Samsung 6th Gen. V-NAND 128L (136T) 3D TLC; Samsung Elpis S4LV003 Controller; OEM version of 980 PRO) |
Samsung PM9A1 MZVL2512HCJQ (512 GB; M.2 2280 PCIe 4.0 x4 NVMe;) (Samsung 6th Gen. V-NAND 128L (136T) 3D TLC; Samsung Elpis S4LV003 Controller; OEM version of 980 PRO) |
| Wi-Fi | 1x 2.5 GbE RJ-45 (Intel I226-V) Intel Wi-Fi 6 AX211 (2x2 802.11ax - 2.4 Gbps) |
1x 2.5 GbE RJ-45 (Intel I226-V) Intel Wi-Fi 6 AX211 (2x2 802.11ax - 2.4 Gbps) |
| Price (in USD, when built) | (Street Pricing on March 27th, 2023) US TBD (barebones) $(148 + TBD) (as configured, no OS) |
(Street Pricing on March 27th, 2023) US TBD (barebones) $(148 + TBD) (as configured, no OS) |
Benchmarks were processed afresh on all of the above systems with the latest BIOS for each. The next few sections will deal with comparative benchmarks for the above systems.
System Performance: UL and BAPCo Benchmarks
Our 2022 Q4 update to the test suite for Windows 11-based systems carries over some of the standard benchmarks we have been using over the last several years, including UL's PCMark. New additions include BAPCo's CrossMark multi-platform benchmarking tool, as well as UL's Procyon benchmark suite. BPACo recently updated their SYSmark benchmark suite - while operational at a basic level, it is missing key features such as energy consumption measurement. We will start including SYSmark 30 once the open issues are resolved.
UL PCMark 10
UL's PCMark 10 evaluates computing systems for various usage scenarios (generic / essential tasks such as web browsing and starting up applications, productivity tasks such as editing spreadsheets and documents, gaming, and digital content creation). We benchmarked select PCs with the PCMark 10 Extended profile and recorded the scores for various scenarios. These scores are heavily influenced by the CPU and GPU in the system, though the RAM and storage device also play a part. The power plan was set to Balanced for all the PCs while processing the PCMark 10 benchmark. The scores for each contributing component / use-case environment are also graphed below.
| UL PCMark 10 - Performance Scores | |||
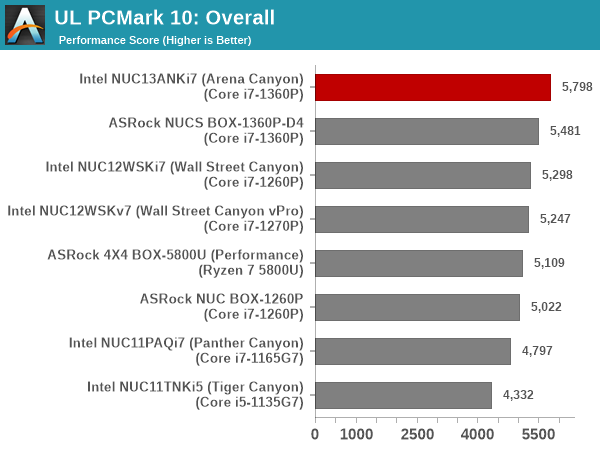
The productivity workload sees the Ryzen 7-5800U system come out on top (thanks probably to the presence of 8 high performance cores), but that system loses steam in other components. The overall scores are along expected lines - the Intel RPL-P system is ahead of the ASRock Industrial RPL-P one, which in turn is a bit in front of the Alder Lake-P systems.
UL Procyon v2.1.544
PCMark 10 utilizes open-source software such as Libre Office and GIMP to evaluate system performance. However, many of their professional benchmark customers have been requesting evaluation with commonly-used commercial software such as Microsoft Office and Adobe applications. In order to serve their needs, UL introduced the Procyon benchmark in late 2020. There are five benchmark categories currently - Office Productivity, AI Inference, Battery Life, Photo Editing, and Video Editing. AI Inference benchmarks are available only for Android devices, while the battery life benchmark is applicable to Windows devices such as notebooks and tablets. We presents results from our processing of the other three benchmarks.
| UL Procyon - Office Productivity Scores | |||
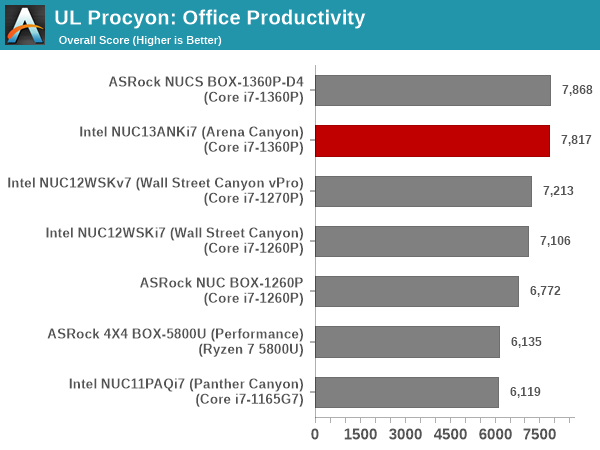
With similar processors and RAM, the NUCS BOX-1360P/D4 and the NUC13ANKi7 perform very similarly across all four components, getting on top in two each. The recorded scores are within the margin of run to run variations.
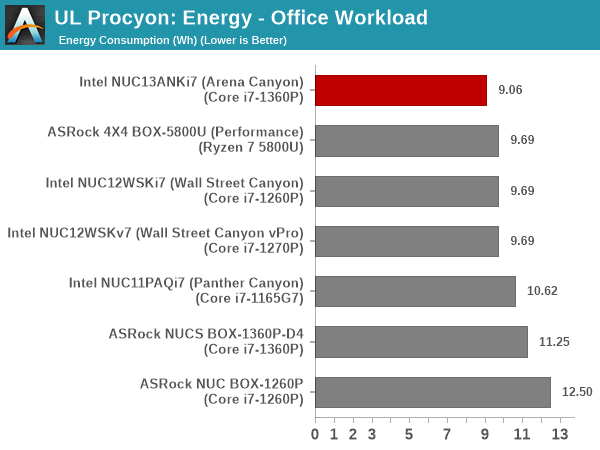
The Arena Canyon NUC forges ahead on the energy consumption front, though. In fact, the ASRock Industrial system comes way beind at 11.25 Wh compared to the Arena Canyon NUC's 9.06 Wh. These numbers can be due to different BIOS optimization targets.
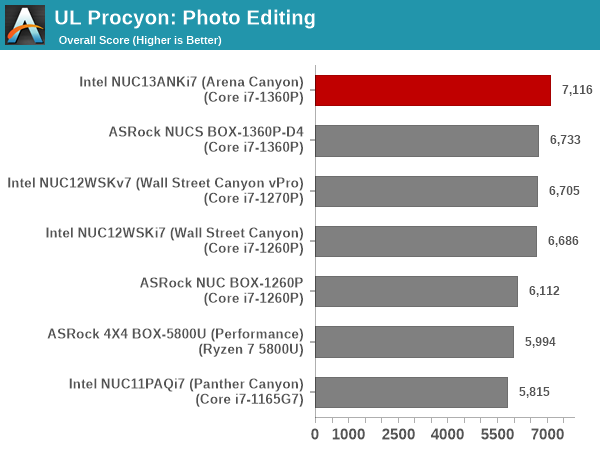
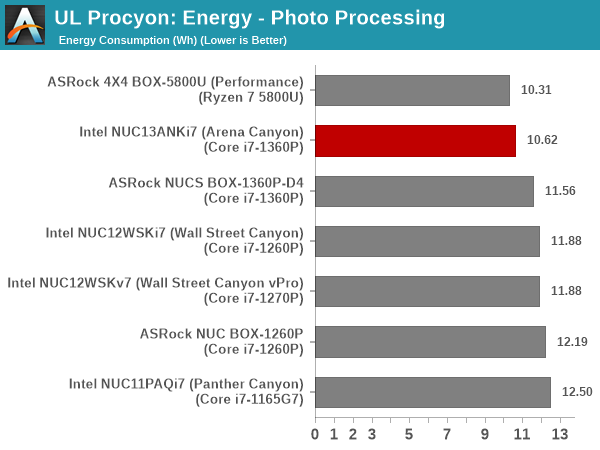
Moving on to the evaluation of Adobe Photoshop and Adobe Lightroom, we find the Arena Canyon NUC come out comfortably on top, but it guzzles a lot more energy in the process compared to the 4x4 BOX-5800U.
UL Procyon evaluates performance for video editing using Adobe Premier Pro, with the GPU playing a major role.
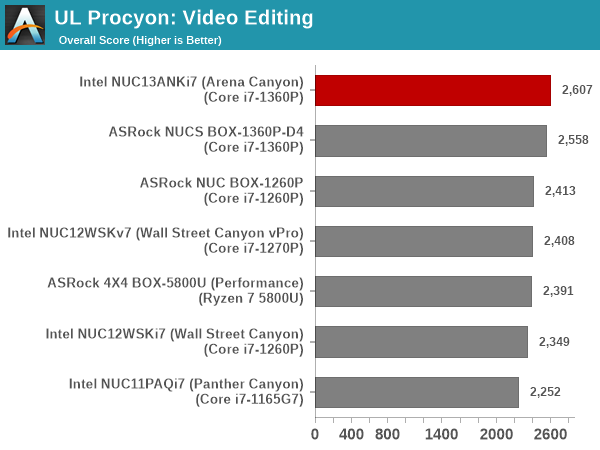
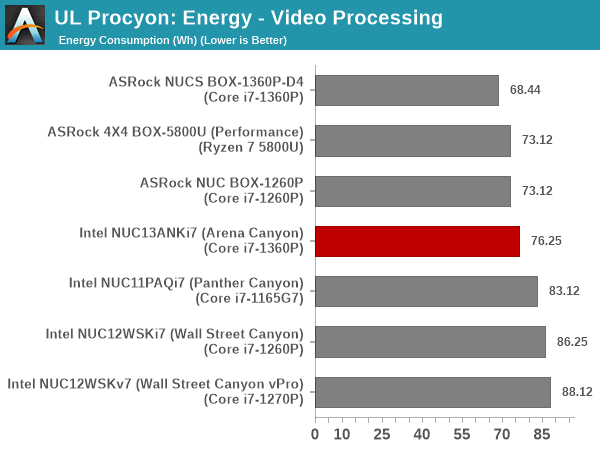
The aggressively clocked iGPU in the Core i7-1360P helps the Arena Canyon NUC and the NUCS BOX-1360P/D4 to deliver similar scores, with the former coming out on top. However, the energy consumption number is significantly higher despite the faster processing.
BAPCo CrossMark 1.0.1.86
BAPCo's CrossMark aims to simplify benchmark processing while still delivering scores that roughly tally with SYSmark. The main advantage is the cross-platform nature of the tool - allowing it to be run on smartphones and tablets as well.
| BAPCo CrossMark 1.0.1.86 - Sub-Category Scores | |||
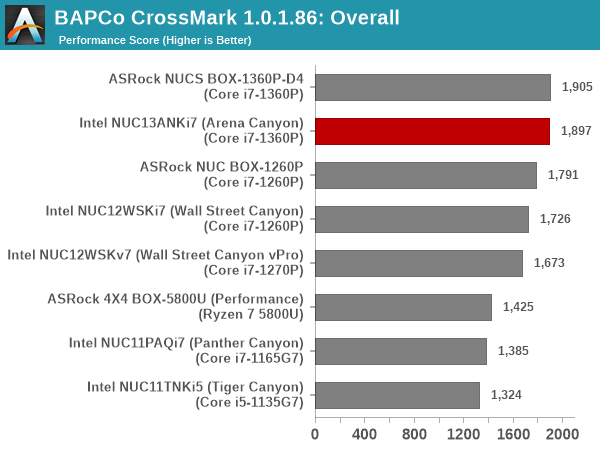
The relative performance seen in PCMark 10 translate to CrossMark also, as expected. The responsiveness ratings vary significantly due to differences in the default BIOS settings for options such as PCIe ASPM etc. We see the ASRock Industrial units emerge with high responsiveness ratings (ASPM disabled by default), while Arena Canyon opts to optimize for power efficiency by enabling ASPM. Overall, we see the Arena Canyon NUC score very similarly to the NUCS BOX-1360P/D4, and well ahead of the rest of the pack.
System Performance: Miscellaneous Workloads
Standardized benchmarks such as UL's PCMark 10 and BAPCo's SYSmark take a holistic view of the system and process a wide range of workloads to arrive at a single score. Some systems are required to excel at specific tasks - so it is often helpful to see how a computer performs in specific scenarios such as rendering, transcoding, JavaScript execution (web browsing), etc. This section presents focused benchmark numbers for specific application scenarios.
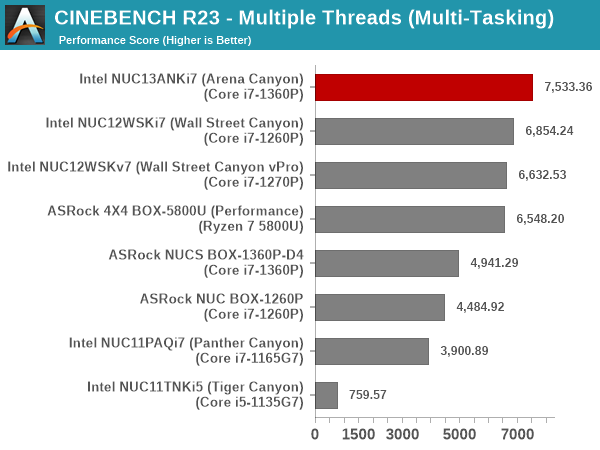
3D Rendering - CINEBENCH R23
We use CINEBENCH R23 for 3D rendering evaluation. R23 provides two benchmark modes - single threaded and multi-threaded. Evaluation of different PC configurations in both supported modes provided us the following results.
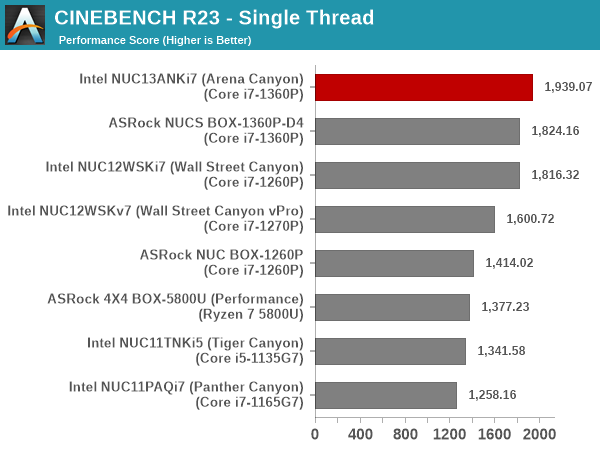
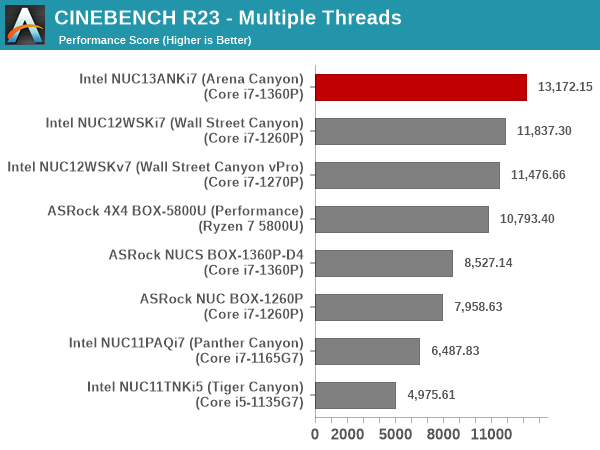
The single-thread performance for the Arena Canyon NUC and the NUCS BOX-1360P/D4 round out the top two spots, but the NUCS BOX loses out significantly in the multi-threaded case due to the lower power budget (PL1 of 28W, compared to 40W for the NUC 13 Pro).
Transcoding: Handbrake 1.5.1
Handbrake is one of the most user-friendly open source transcoding front-ends in the market. It allows users to opt for either software-based higher quality processing or hardware-based fast processing in their transcoding jobs. Our new test suite uses the 'Tears of Steel' 4K AVC video as input and transcodes it with a quality setting of 19 to create a 720p AVC stream and a 1080p HEVC stream.
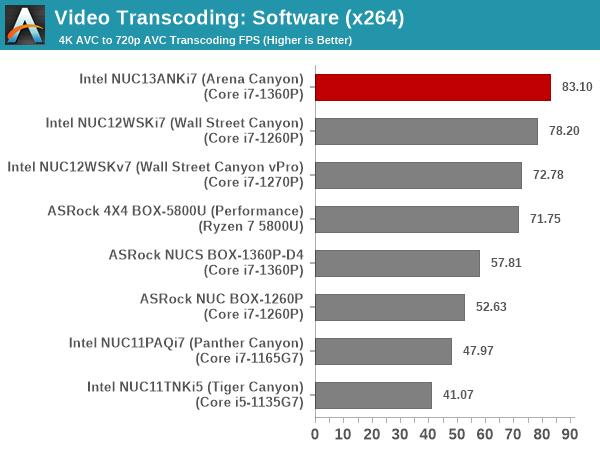
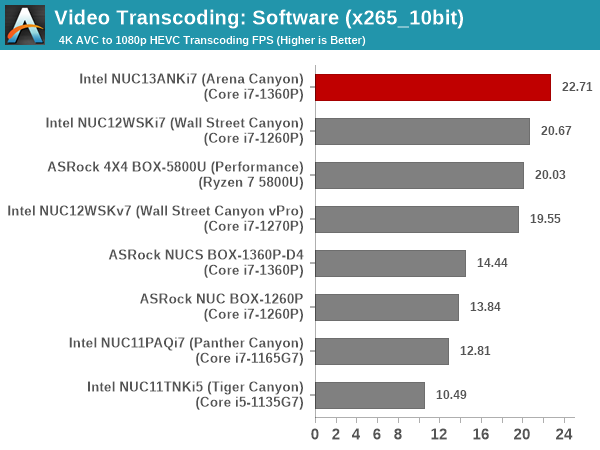
Software transcoding performance is dependent on the available power budget and number of cores. The Arena Canyon NUC is on top in both of these aspects, and it is not a surprise to see it march well ahead of the competition.

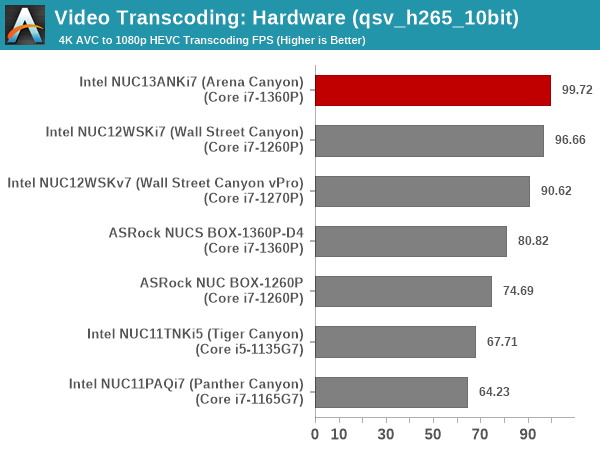
Hardware transcoding performance is dependent on the iGPU clock speeds and Raptor Lake-P is the best equipped family on that front. The extra power budget over the ASRock Industrial configuration helps the Arena Canyon NUC come out on top.
Archiving: 7-Zip 21.7
The 7-Zip benchmark is carried over from our previous test suite with an update to the latest version of the open source compression / decompression software.
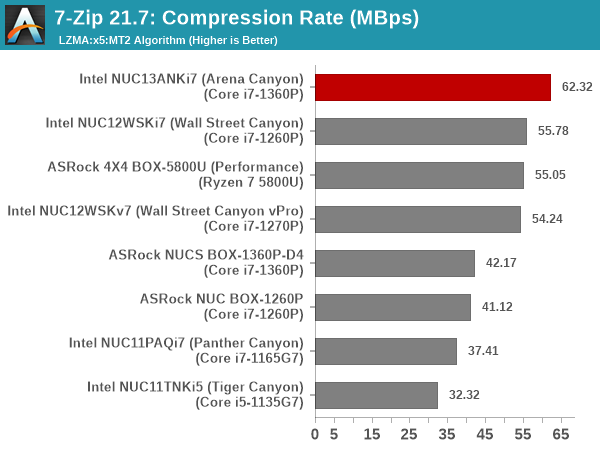
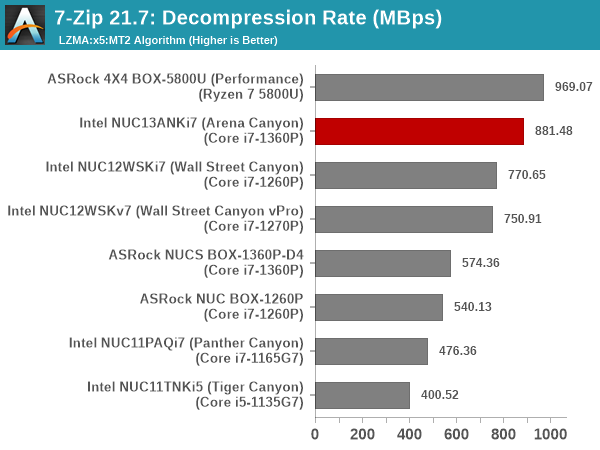
The power budget and number of cores helps the Arena Canyon NUC take the top spot in the compression component, but the Ryzen 7-5800U has enough chops to take the crown in the decompression test. Within the Intel family, the RPL-P implementation from Intel is the undisputed leader in both components.
Web Browsing: JetStream, Speedometer, and Principled Technologies WebXPRT4
Web browser-based workloads have emerged as a major component of the typical home and business PC usage scenarios. For headless systems, many applications based on JavaScript are becoming relevant too. In order to evaluate systems for their JavaScript execution efficiency, we are carrying over the browser-focused benchmarks from the WebKit developers used in our notebook reviews. Hosted at BrowserBench, JetStream 2.0 benchmarks JavaScript and WebAssembly performance, while Speedometer measures web application responsiveness.
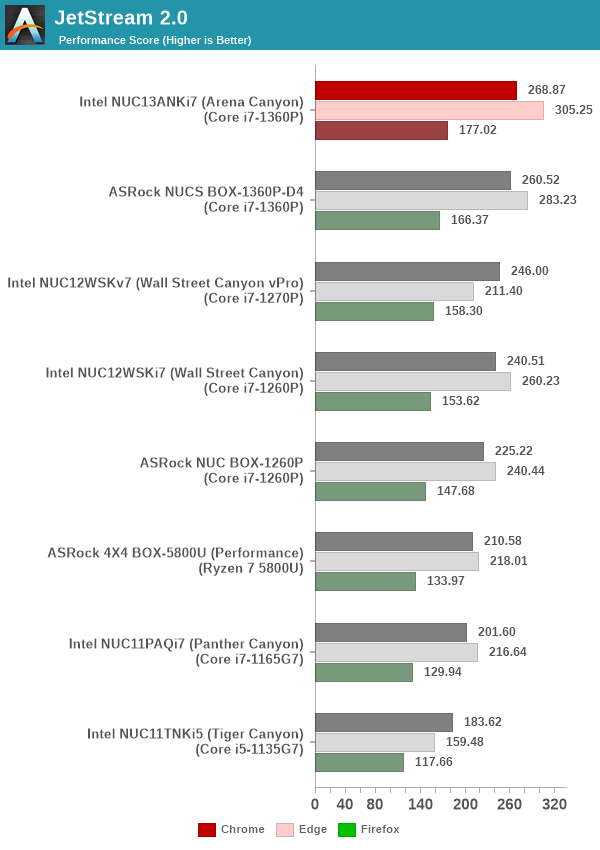
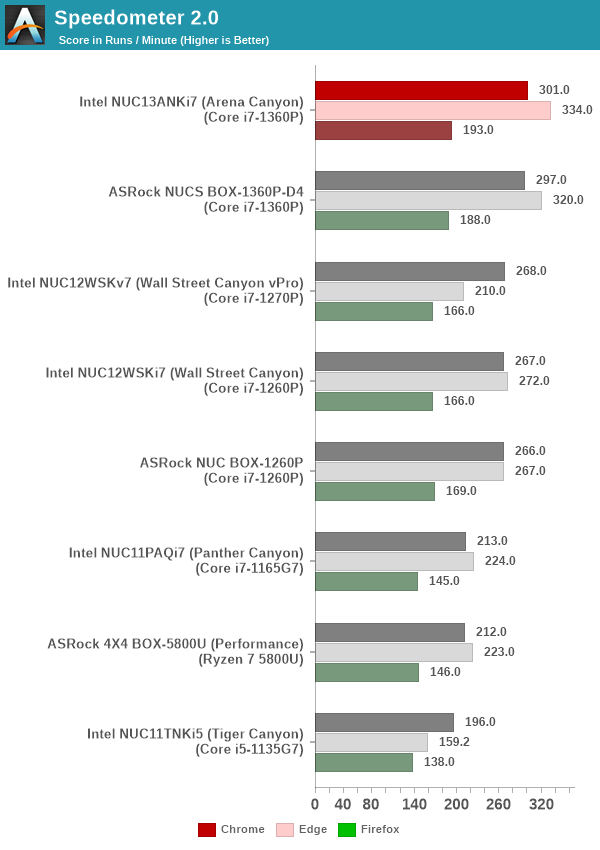
From a real-life workload perspective, we also process WebXPRT4 from Principled Technologies. WebXPRT4 benchmarks the performance of some popular JavaScript libraries that are widely used in websites.
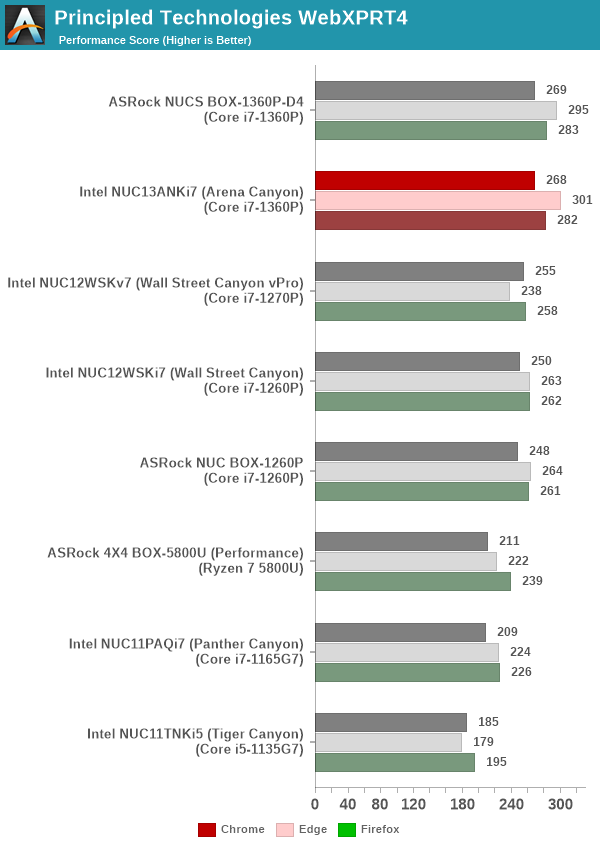
In sustained benchmarking (like in Jetstream and Speedometer), the PL1 and PL2 values influence the results allowing the Arena Canyon NUC to take the top spot. However, in the more realistic use-case with webXPRT4, the NUC 13 Pro and the ASRock Industrial NUCS BOX-1360P/D4 perform very similar to each other across different browsers.
Application Startup: GIMP 2.10.30
A new addition to our systems test suite is AppTimer - a benchmark that loads up a program and determines how long it takes for it to accept user inputs. We use GIMP 2.10.30 with a 50MB multi-layered xcf file as input. What we test here is the first run as well as the cached run - normally on the first time a user loads the GIMP package from a fresh install, the system has to configure a few dozen files that remain optimized on subsequent opening. For our test we delete those configured optimized files in order to force a fresh load every second time the software is run.
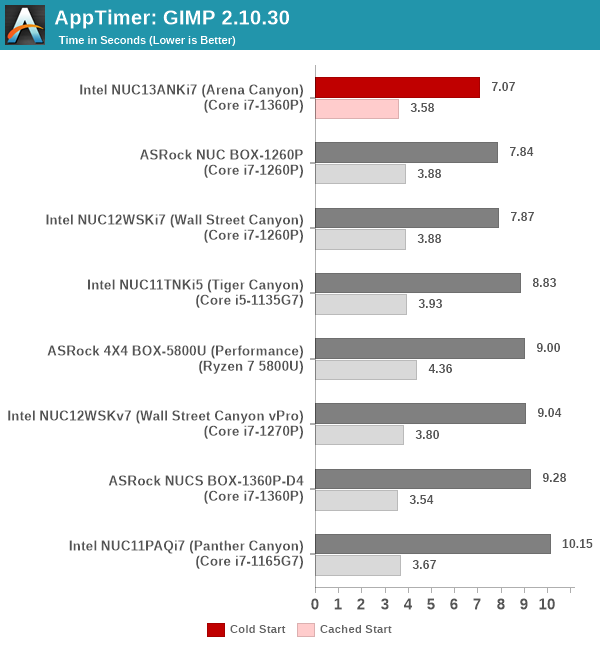
As it turns out, GIMP does optimizations for every CPU thread in the system, which requires that higher thread-count processors take a lot longer to run. So the test runs quick on systems with fewer threads, however fast cores are also needed. The cached start numbers for the ASRock Industrial system and the Arena Canyon NUC are similar, but the latter is significantly better in the cold start scenario.
Cryptography Benchmarks
Cryptography has become an indispensable part of our interaction with computing systems. Almost all modern systems have some sort of hardware-acceleration for making cryptographic operations faster and more power efficient. In the case of business use-cases, many applications such as VPN need cryptography acceleration.
BitLocker is a Windows features that encrypts entire disk volumes. While drives that offer encryption capabilities are dealt with using that feature, most legacy systems and external drives have to use the host system implementation. Windows has no direct benchmark for BitLocker. However, we cooked up a BitLocker operation sequence to determine the adeptness of the system at handling BitLocker operations. We start off with a 4.5GB RAM drive in which a 4GB VHD (virtual hard disk) is created. This VHD is then mounted, and BitLocker is enabled on the volume. Once the BitLocker encryption process gets done, BitLocker is disabled. This triggers a decryption process. The times taken to complete the encryption and decryption are recorded. This process is repeated 25 times, and the average of the last 20 iterations is graphed below.
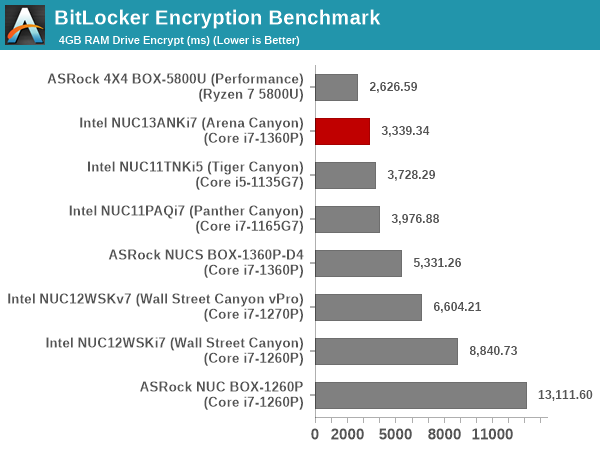
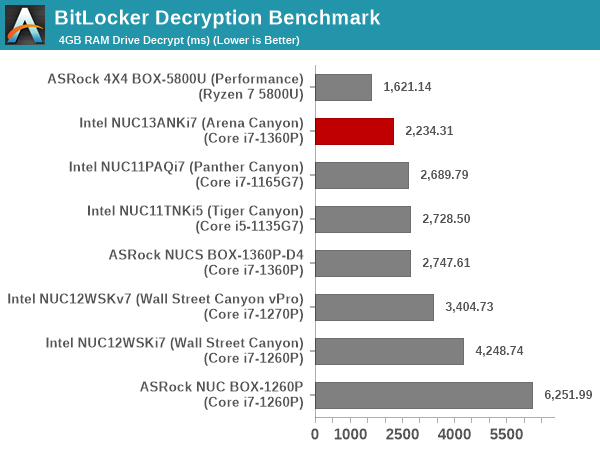
Hardware acceleration is available for the operations in all of the systems. The time taken for processing is directly dependent on the available power budget. Faster acceleration with more number of stronger cores in the Ryzen 7-5800U help the 4x4 BOX-5800U perform significantly better than the rest of the systems in this benchmark. The Arena Canyon NUC turns out to be the best of the Intel lot, as one would expect from the latest generation.
GPU Performance: Synthetic Benchmarks
Intel did not make significant changes in the integrated GPU when moving from Alder Lake to Raptor Lake. Process maturity has allowed it to clock the iGPU a bit higher, but the number of EUs remains the same as in the previous generation. GPU performance evaluation typically involved gaming workloads, and for select PCs, GPU compute. Prior to that, we wanted to take a look at the capabilities of the iGPU in the Core i7-1360P. Unfortunately, GPU-Z doesn't yet recognize the 'new' GPU, but HWiNFO has more helpful information tallying with the claimed iGPU specifications.
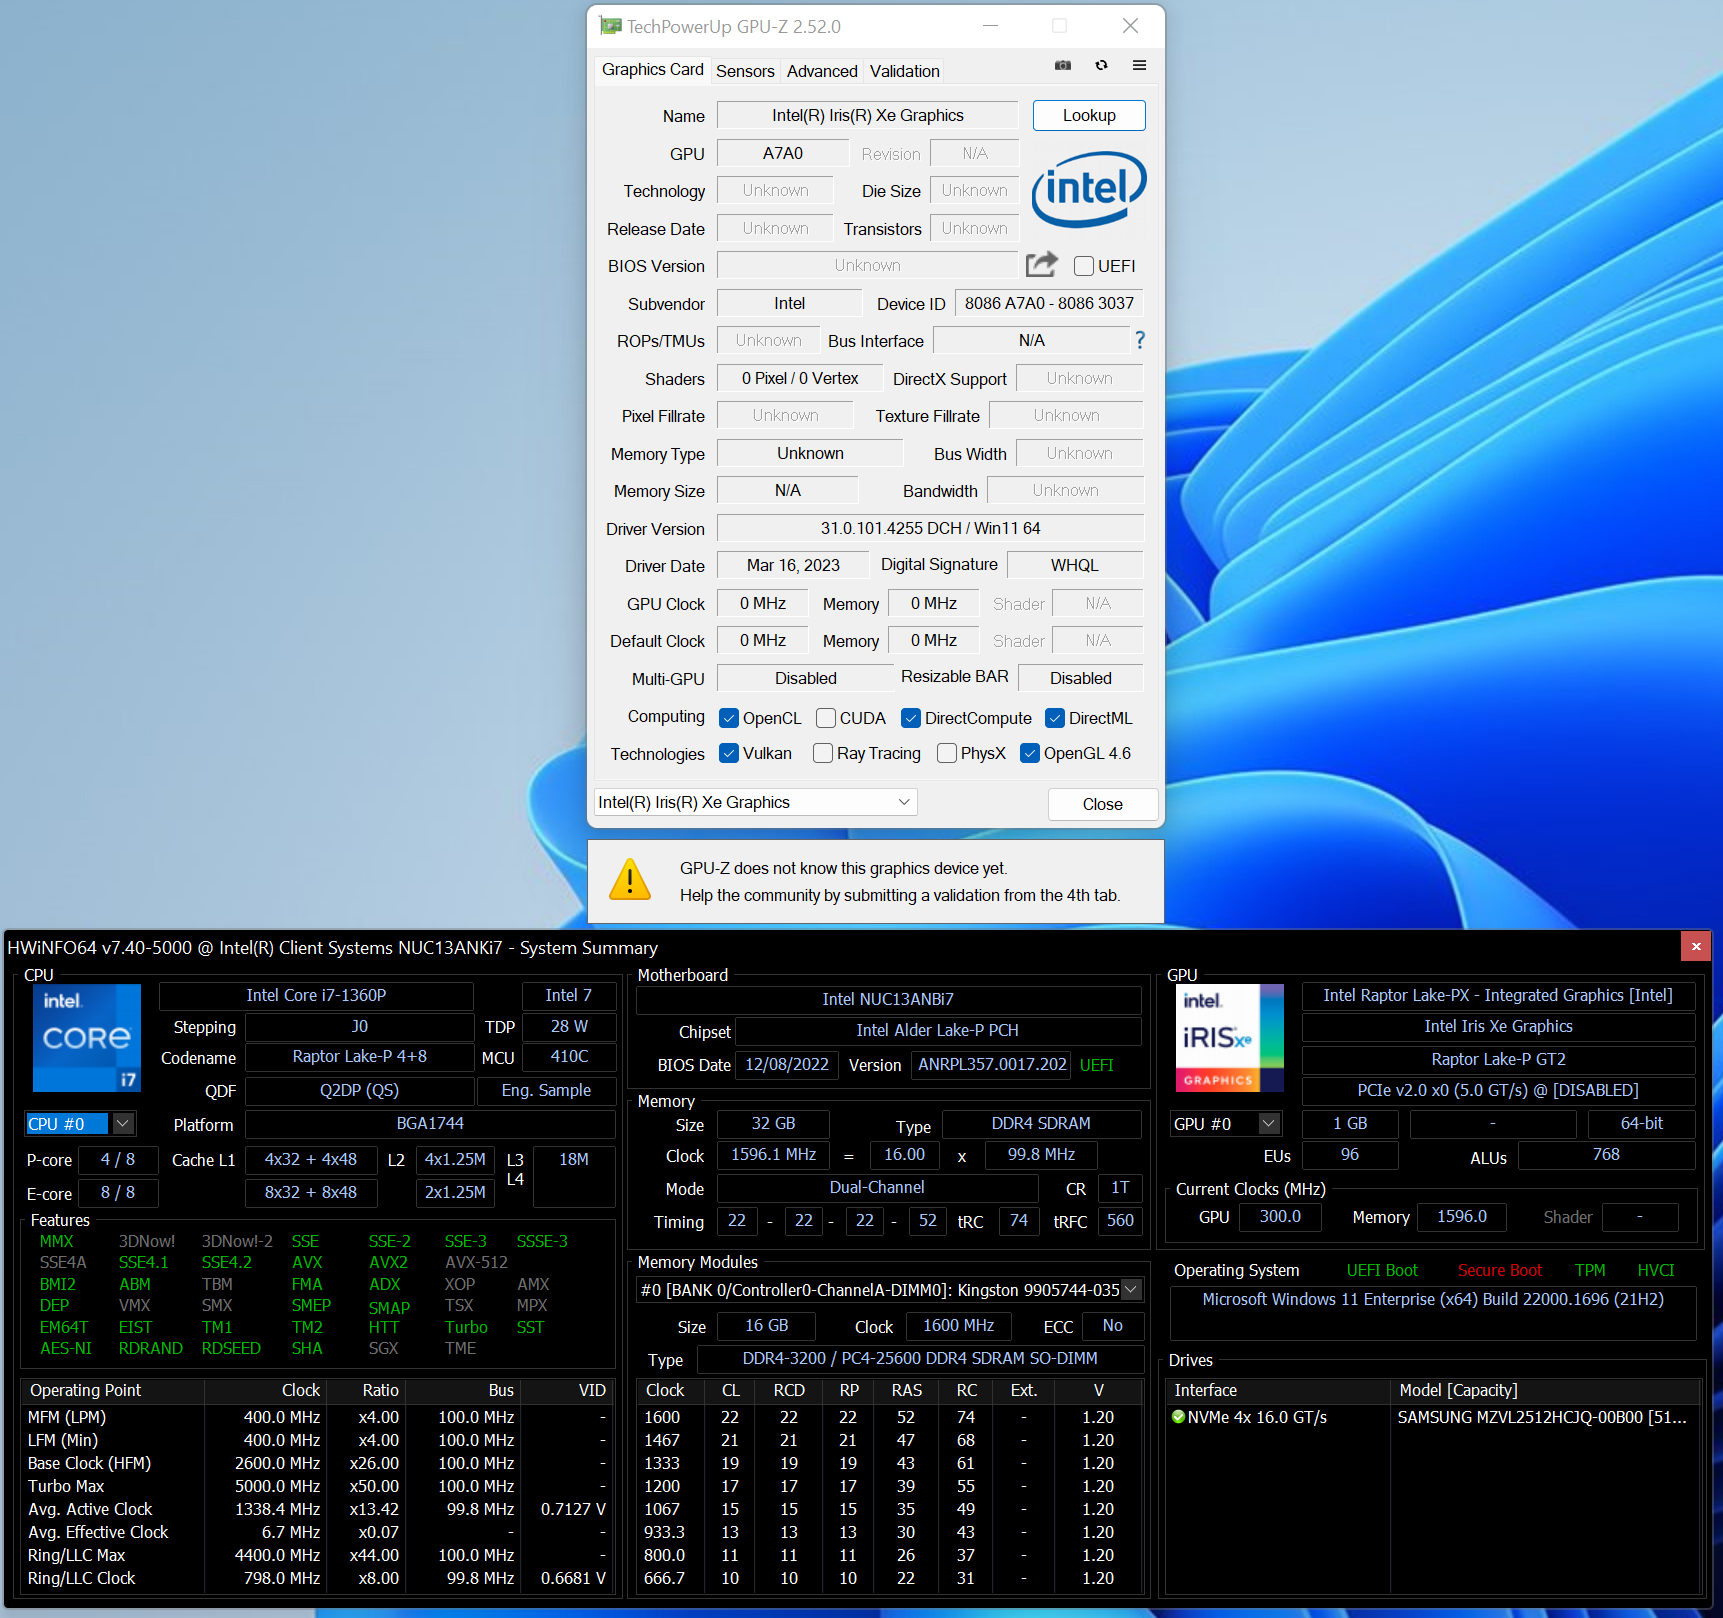
We have seen earlier that the performance of the Intel Iris Xe Graphics is miles ahead of previous iGPUs from both Intel and AMD. The benchmarks processed on the NUC13ANKi7 back up that aspect.
GFXBench
The DirectX 12-based GFXBench tests from Kishonti are cross-platform, and available all the way down to smartphones. As such, they are not very taxing for discrete GPUs and modern integrated GPUs. We processed the offscreen versions of the 'Aztec Ruins' benchmark.
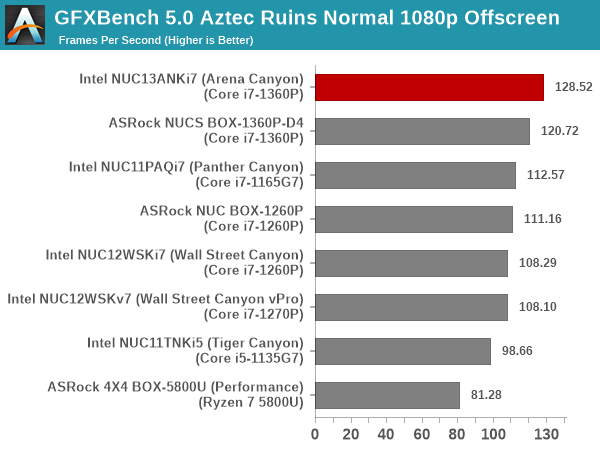
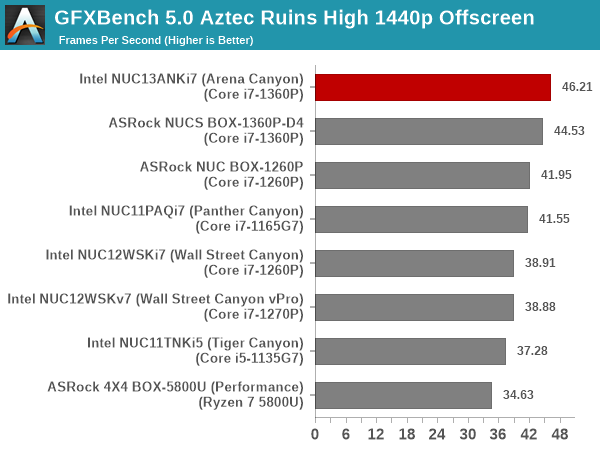
The 1.5 GHz clock and high EU count expectedly land the Arena Canyon NUC at the top of the file.
UL 3DMark
Four different workload sets were processed in 3DMark - Fire Strike, Time Spy, Night Raid, and Wild Life.
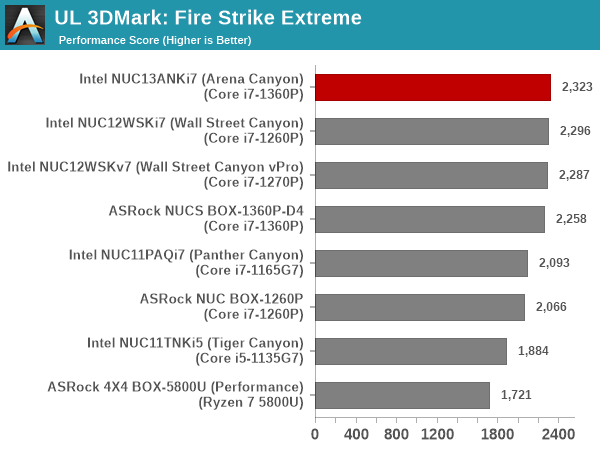
3DMark Fire Strike
The Fire Strike benchmark has three workloads. The base version is meant for high-performance gaming PCs. It uses DirectX 11 (feature level 11) to render frames at 1920 x 1080. The Extreme version targets 1440p gaming requirements, while the Ultra version targets 4K gaming system, and renders at 3840 x 2160. The graph below presents the overall score for the Fire Strike Extreme and Fire Strike Ultra benchmark across all the systems that are being compared.
| UL 3DMark - Fire Strike Workloads | |||
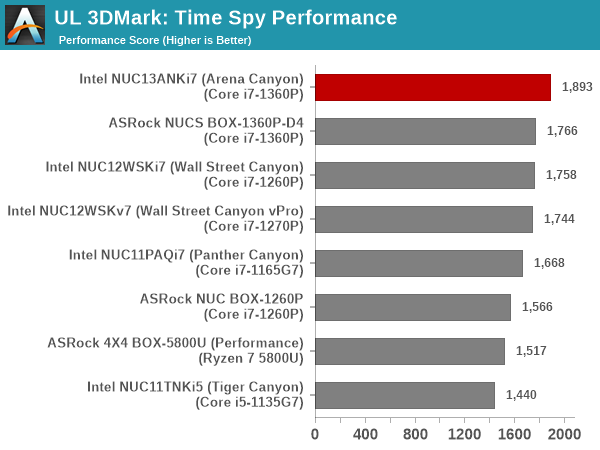
3DMark Time Spy
The Time Spy workload has two levels with different complexities. Both use DirectX 12 (feature level 11). However, the plain version targets high-performance gaming PCs with a 2560 x 1440 render resolution, while the Extreme version renders at 3840 x 2160 resolution. The graphs below present both numbers for all the systems that are being compared in this review.
| UL 3DMark - Time Spy Workloads | |||
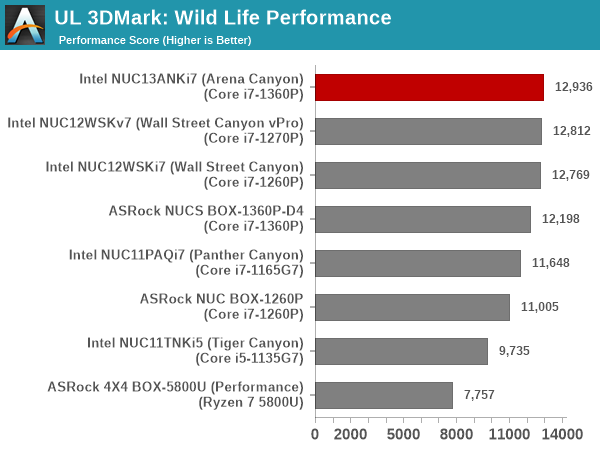
3DMark Wild Life
The Wild Life workload was initially introduced as a cross-platform GPU benchmark in 2020. It renders at a 2560 x 1440 resolution using Vulkan 1.1 APIs on Windows. It is a relatively short-running test, reflective of mobile GPU usage. In mid-2021, UL released the Wild Life Extreme workload that was a more demanding version that renders at 3840 x 2160 and runs for a much longer duration reflective of typical desktop gaming usage.
| UL 3DMark - Wild Life Workloads | |||
3DMark Night Raid
The Night Raid workload is a DirectX 12 benchmark test. It is less demanding than Time Spy, and is optimized for integrated graphics. The graph below presents the overall score in this workload for different system configurations.
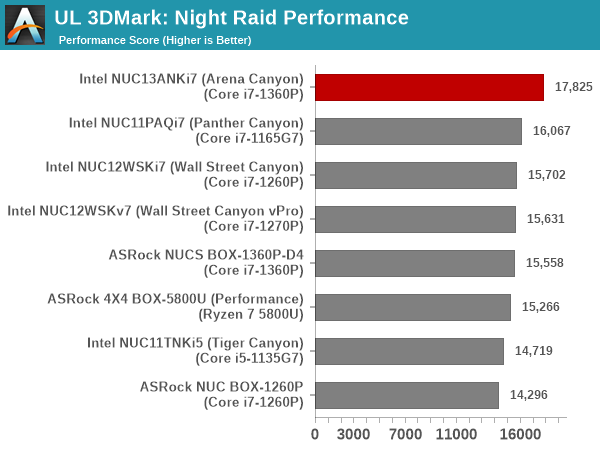
All of the above benchmarks see the NUC13ANKi7 emerge comfortably on top. Having the fastest iGPU clock and highest power budget mean that this is not a surprising result.
System Performance: Multi-Tasking
One of the key drivers of advancements in computing systems is multi-tasking. On mobile devices, this is quite lightweight - cases such as background email checks while the user is playing a mobile game are quite common. Towards optimizing user experience in those types of scenarios, mobile SoC manufacturers started integrating heterogeneous CPU cores - some with high performance for demanding workloads, while others were frugal in terms of both power consumption / die area and performance. This trend is now slowly making its way into the desktop PC space.
Multi-tasking in typical PC usage is much more demanding compared to phones and tablets. Desktop OSes allow users to launch and utilize a large number of demanding programs simultaneously. Responsiveness is dictated largely by the OS scheduler allowing different tasks to move to the background. Intel's Alder Lake processors work closely with the Windows 11 thread scheduler to optimize performance in these cases. Keeping these aspects in mind, the evaluation of multi-tasking performance is an interesting subject to tackle.
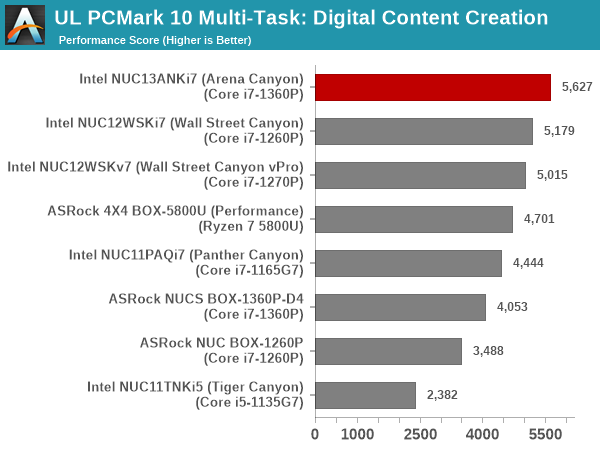
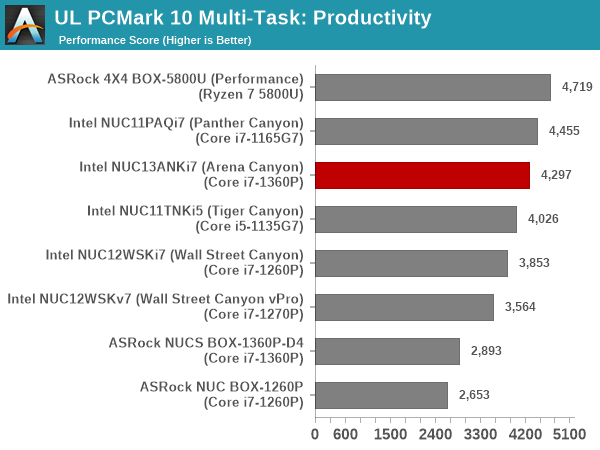
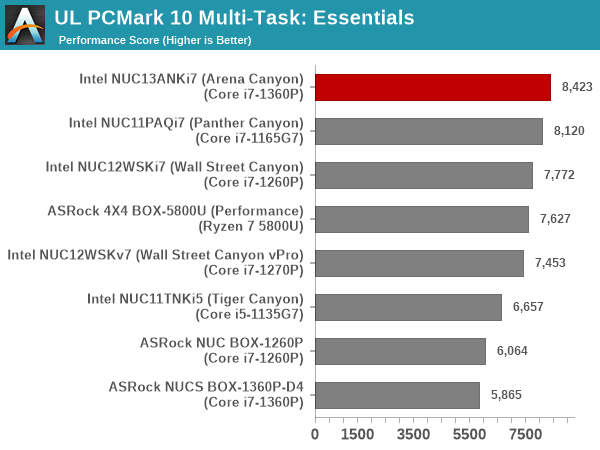
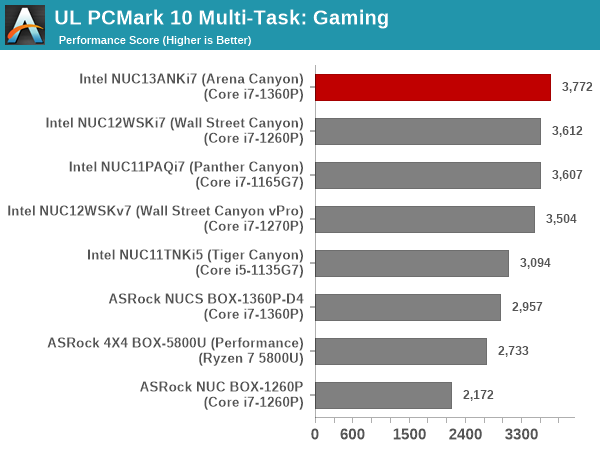
We have augmented our systems benchmarking suite to quantitatively analyze the multi-tasking performance of various platforms. The evaluation involves triggering a ffmpeg transcoding task to transform 1716 3840x1714 frames encoded as a 24fps AVC video (Blender Project's 'Tears of Steel' 4K version) into a 1080p HEVC version in a loop. The transcoding rate is monitored continuously. One complete transcoding pass is allowed to complete before starting the first multi-tasking workload - the PCMark 10 Extended bench suite. A comparative view of the PCMark 10 scores for various scenarios is presented in the graphs below. Also available for concurrent viewing are scores in the normal case where the benchmark was processed without any concurrent load, and a graph presenting the loss in performance
| UL PCMark 10 Load Testing - Digital Content Creation Scores | |||
| UL PCMark 10 Load Testing - Productivity Scores | |||
| UL PCMark 10 Load Testing - Essentials Scores | |||
| UL PCMark 10 Load Testing - Gaming Scores | |||
| UL PCMark 10 Load Testing - Overall Scores | |||
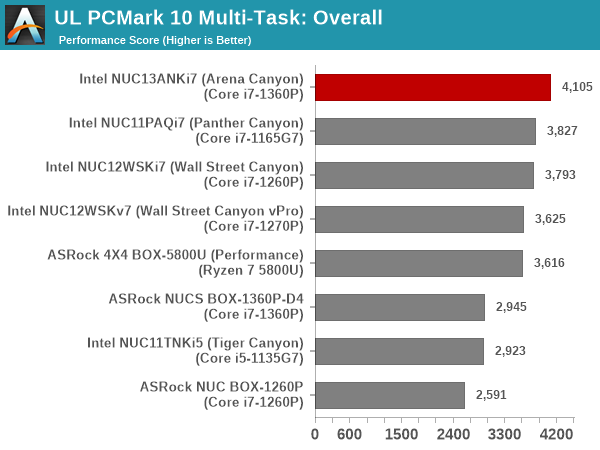
All PCMark 10 workload components see the relative ordering being maintained even after the addition of the concurrent loading.
Following the completion of the PCMark 10 benchmark, a short delay is introduced prior to the processing of Principled Technologies WebXPRT4 on MS Edge. Similar to the PCMark 10 results presentation, the graph below show the scores recorded with the transcoding load active. Available for comparison are the dedicated CPU power scores and a measure of the performance loss.
| Principled Technologies WebXPRT4 Load Testing Scores (MS Edge) | |||
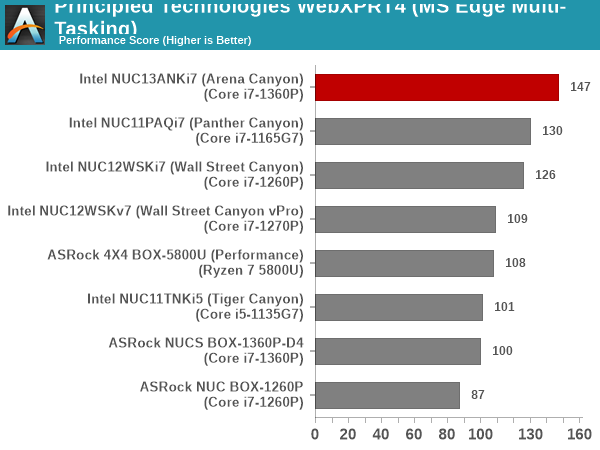
Despite a 50% performance loss, the NUC13ANKi7 retains a signficant lead over the other systems in webXPRT4 in the presence of the transcoding workload.
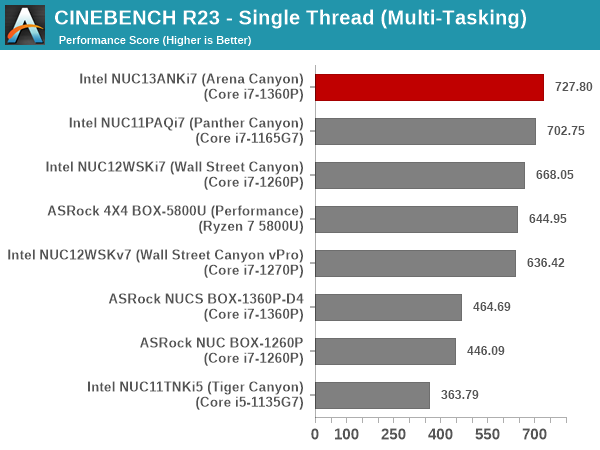
The final workload tested as part of the multitasking evaluation routine is CINEBENCH R23.
| 3D Rendering - CINEBENCH R23 Load Testing - Single Thread Score | |||
| 3D Rendering - CINEBENCH R23 Load Testing - Multiple Thread Score | |||
We see a 60%+ drop in the single thread case, and a 40%+ drop for the multi-threaded case, but the raw numbers are still well in favor of the NUC13ANKi7.
The latest version of Windows 11 (22H2) apparently has some additional thread scheduling improvements that can help Alder Lake and Raptor Lake deliver better / more balanced performance for multi-tasking scenarios. We may get a chance to evaluate that a few quarters down the line.
HTPC and Digital Signage Credentials
The 2022 Q4 update to our system reviews brings an updated media playback evaluation suite for systems. After doing away with the evaluation of display refresh rate stability and Netflix streaming evaluation, the local media playback configurations have also seen a revamp. This section details each of the workloads processed on the Intel NUC13ANKi7 (Arena Canyon).
YouTube Streaming Efficiency
YouTube continues to remain one of the top OTT platforms, primarily due to its free ad-supported tier. Our HTPC test suite update retains YouTube streaming efficiency evaluation as a metric of OTT support in different systems. Mystery Box's Peru 8K HDR 60FPS video is the chosen test sample. On PCs running Windows, it is recommended that HDR streaming videos be viewed using the Microsoft Edge browser after putting the desktop in HDR mode.
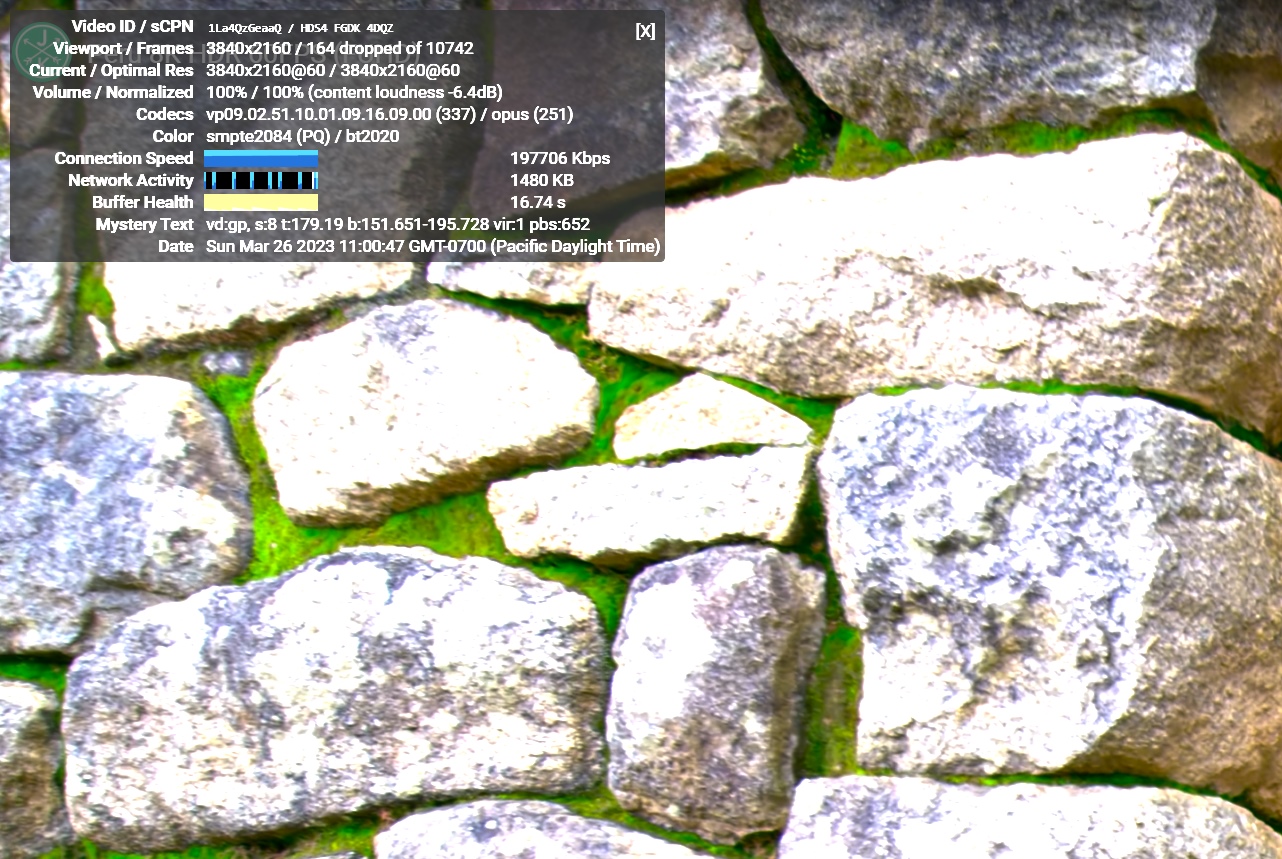
YouTube Streaming Statistics
The GPU in Intel NUC13ANKi7 (Arena Canyon) supports hardware decoding of VP9 Profile 2, and we see the stream encoded with that codec being played back. The streaming is perfect, thanks to the powerful GPU and hardware decoding support - the dropped frames observed in the statistics below are due to mouse clicks involved in bringing up the overlay.
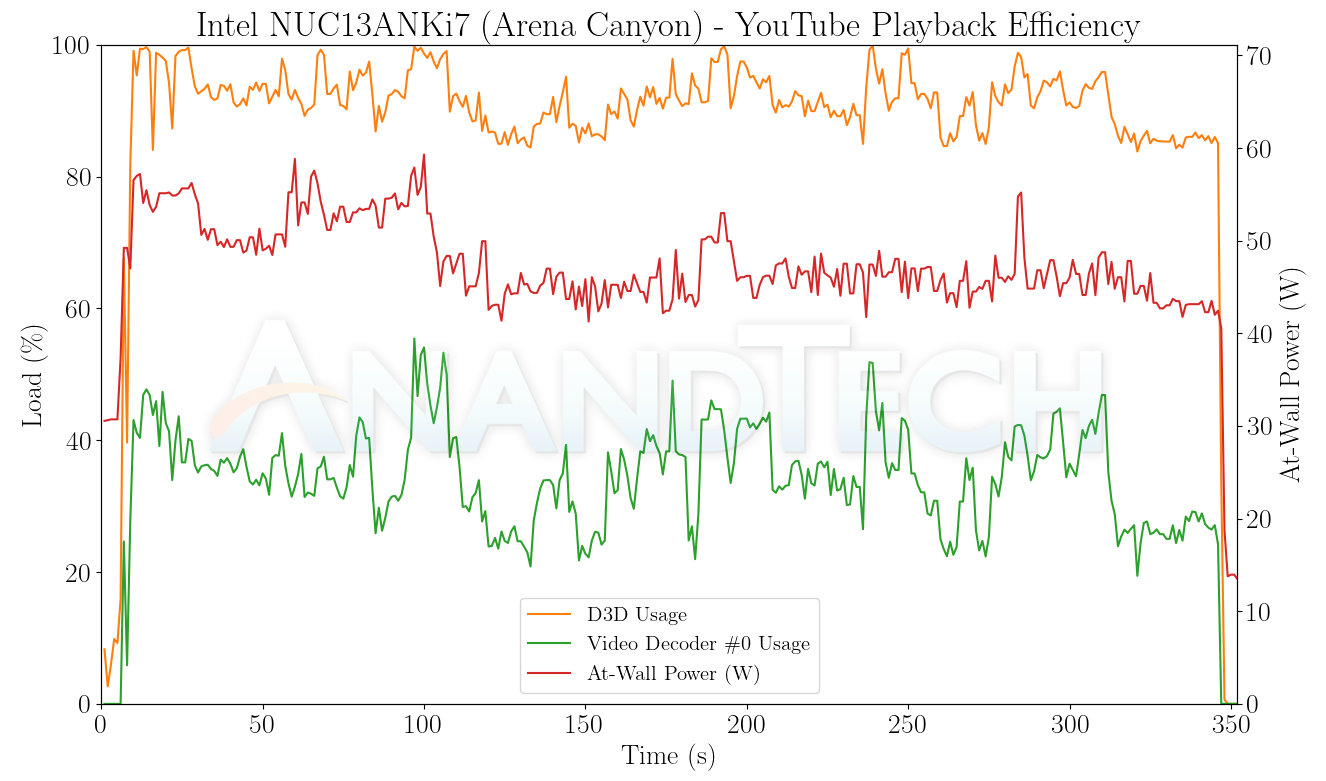
The streaming efficiency-related aspects such as GPU usage and at-wall power consumption are also graphed below.
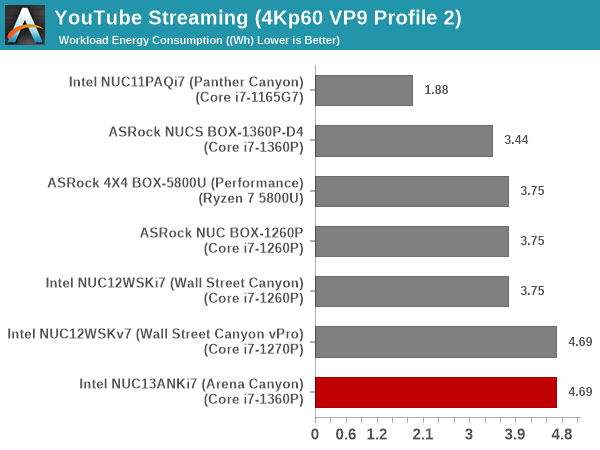
Energy consumption is a bit of a mixed bag, with the Arena Canyon NUC turning out to be the worst of the lot. It is possible that the iGPU drivers are to blame, but we do not see the issue in other playback workloads.
Hardware-Accelerated Encoding and Decoding
The transcoding benchmarks in the systems performance section presented results from evaluating the QuickSync encoder within Handbrake's framework. The capabilities of the decoder engine are brought out by DXVAChecker.
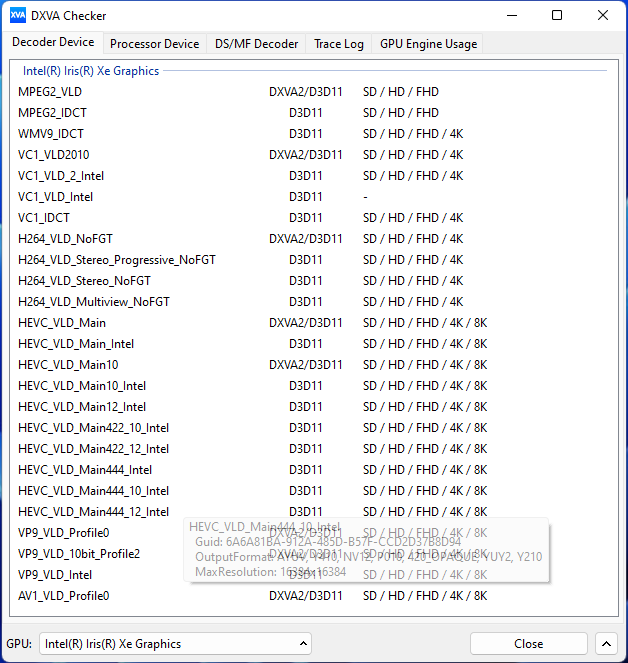
Video Decoding Hardware Acceleration in Intel NUC13ANKi7 (Arena Canyon)
The iGPU in Raptor Lake-P system supports hardware decode for a variety of codecs including AVC, JPEG, HEVC (8b and 10b, 4:2:0 and 4:4:4), and VP9 (8b and 10b, 4:2:0 and 4:4:4). AV1 decode support is also present. This is currently the most comprehensive codec support seen in the PC space.
Local Media Playback
Evaluation of local media playback and video processing is done by playing back files encompassing a range of relevant codecs, containers, resolutions, and frame rates. A note of the efficiency is also made by tracking GPU usage and power consumption of the system at the wall. Users have their own preference for the playback software / decoder / renderer, and our aim is to have numbers representative of commonly encountered scenarios. Our Q4 2022 test suite update replaces MPC-HC (in LAV filters / madVR modes) with mpv. In addition to being cross-platform and open-source, the player allows easy control via the command-line to enable different shader-based post-processing algorithms. From a benchmarking perspective, the more attractive aspect is the real-time reporting of dropped frames in an easily parseable manner. The players / configurations considered in this subsection include:
- VLC 3.0.18
- Kodi 20.0b1
- mpv 0.35 (hwdec auto, vo=gpu-next)
- mpv 0.35 (hwdec auto, vo=gpu-next, profile=gpu-hq)
Fourteen test streams (each of 90s duration) were played back from the local disk with an interval of 30 seconds in-between. Various metrics including GPU usage, at-wall power consumption, and total energy consumption were recorded during the course of this playback.
All our playback tests were done with the desktop HDR setting turned on. It is possible for certain system configurations to automatically turn on/off the HDR capabilities prior to the playback of a HDR video, but, we didn't take advantage of that in our testing.
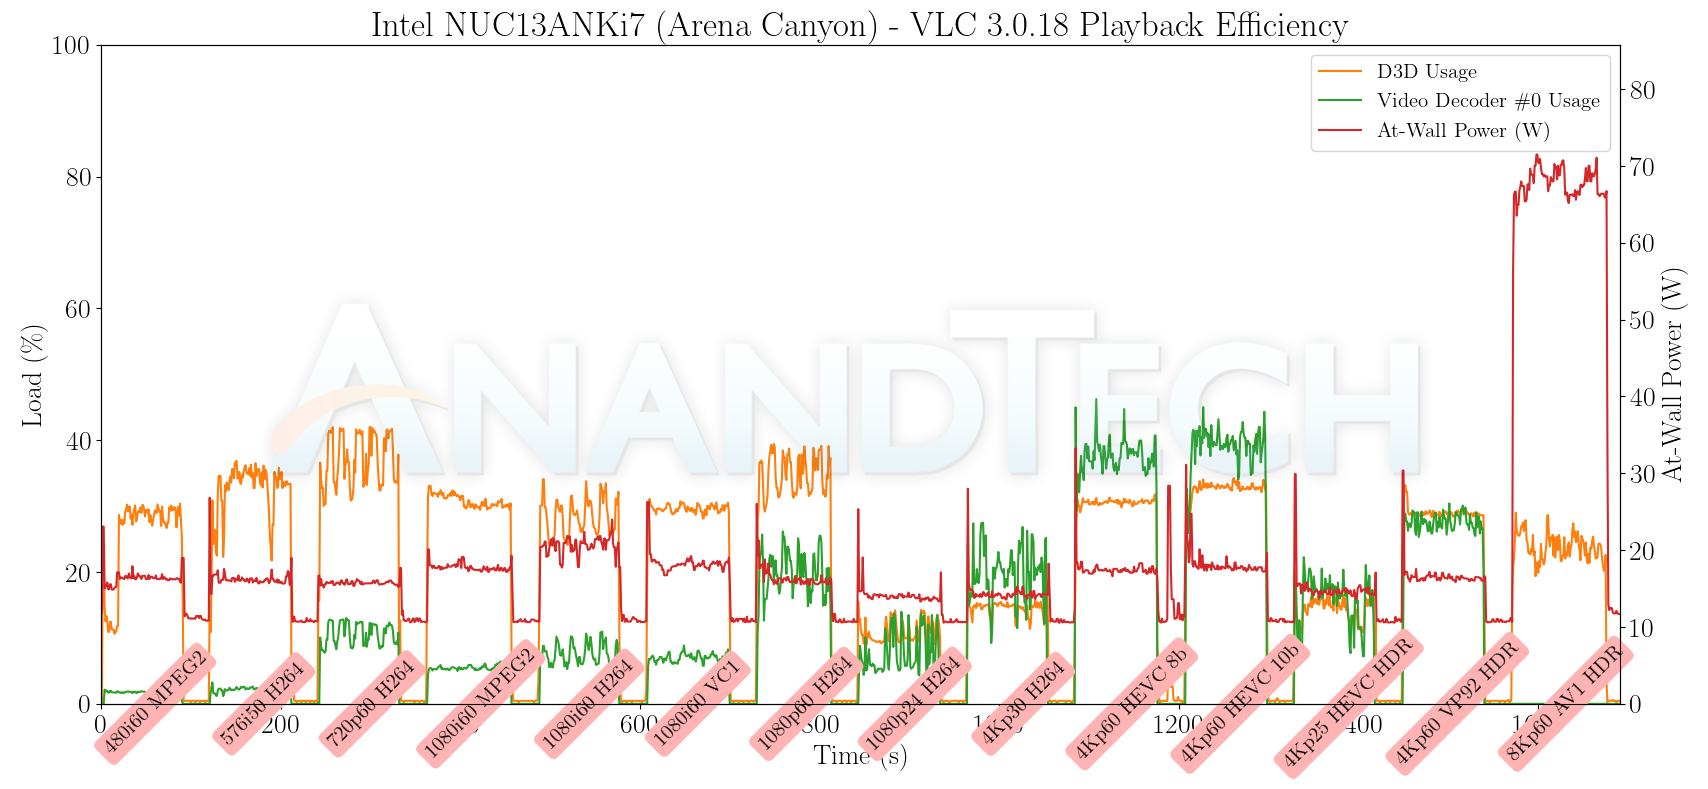
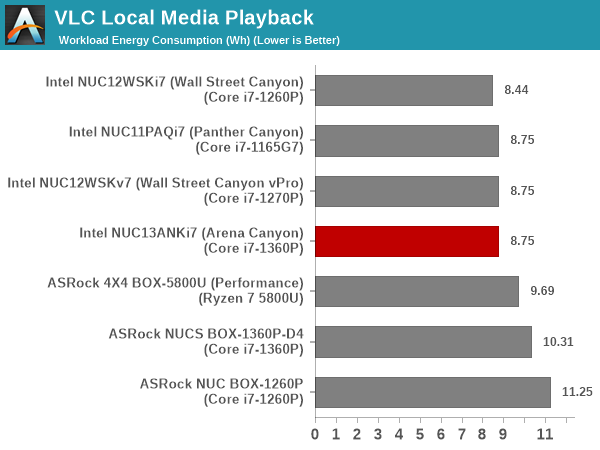
Playback was perfect for all codecs except AV1 (the CPU is not strong enough for software-only 8Kp60 decoding). Power consumption numbers are reasonable, and help the Arena Canyon NUC land up in the middle of the pack.
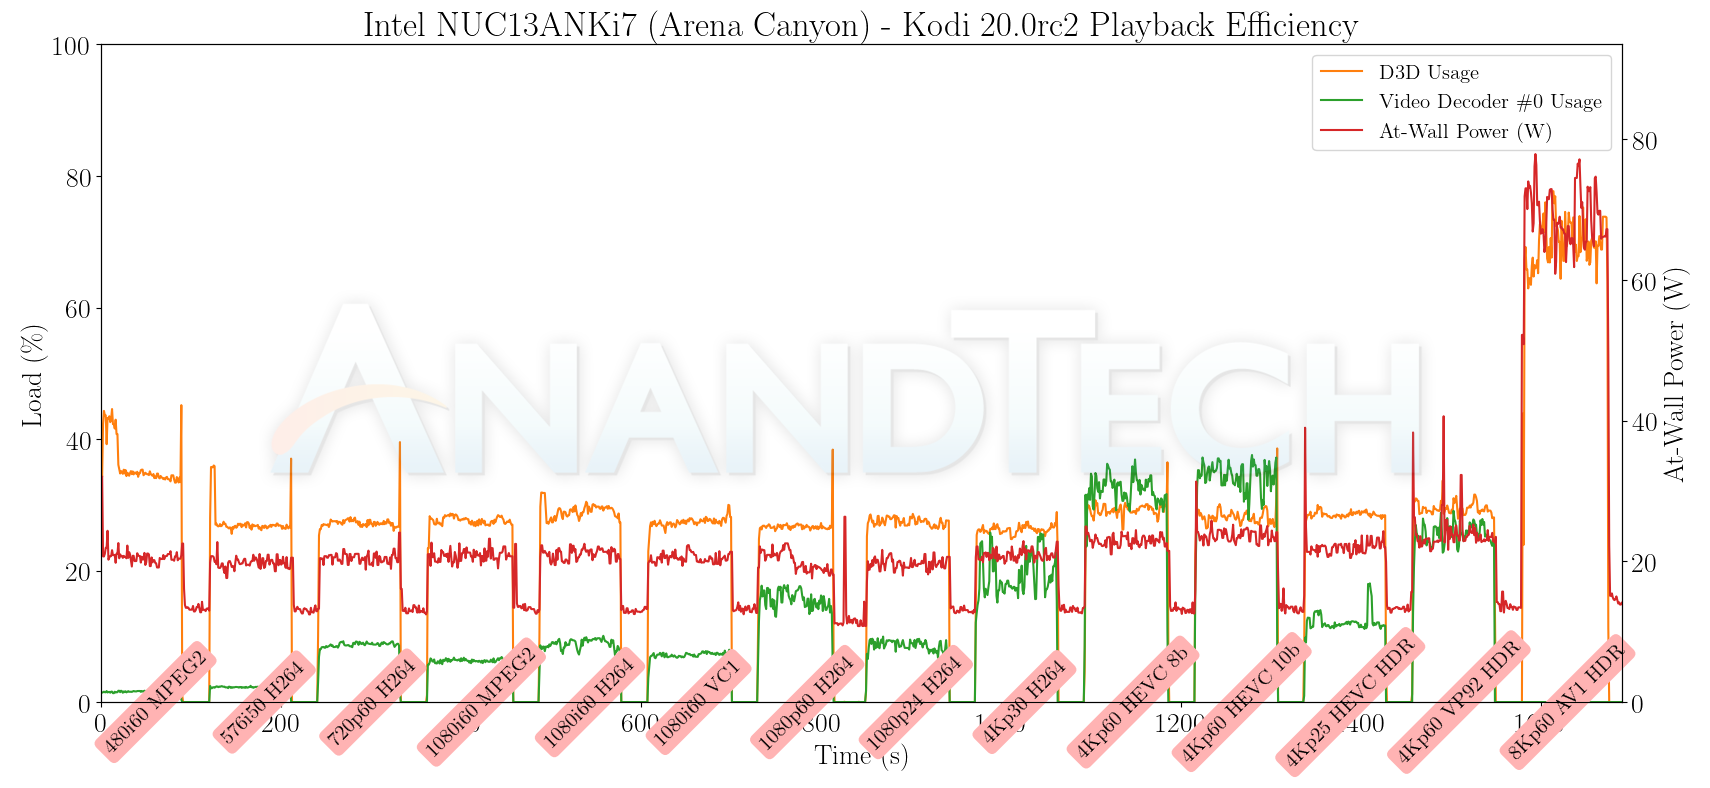
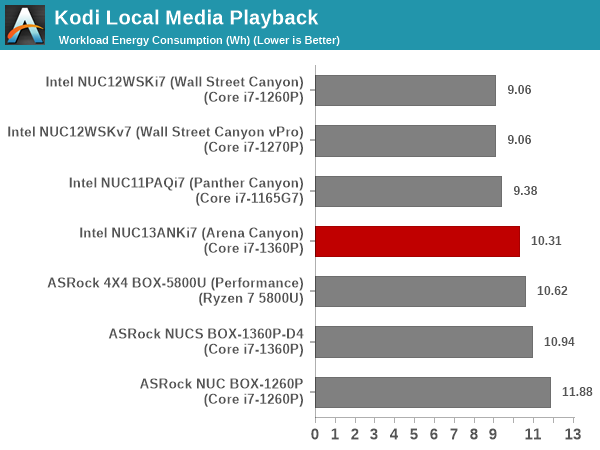
The scenario seen with VLC is replicated in Kodi also. The middle-of-the-pack entry seen in the VLC case makes an appearance here also, with the software decoding attempt for AV1 being one of the main causes for the spike in the energy numbers.
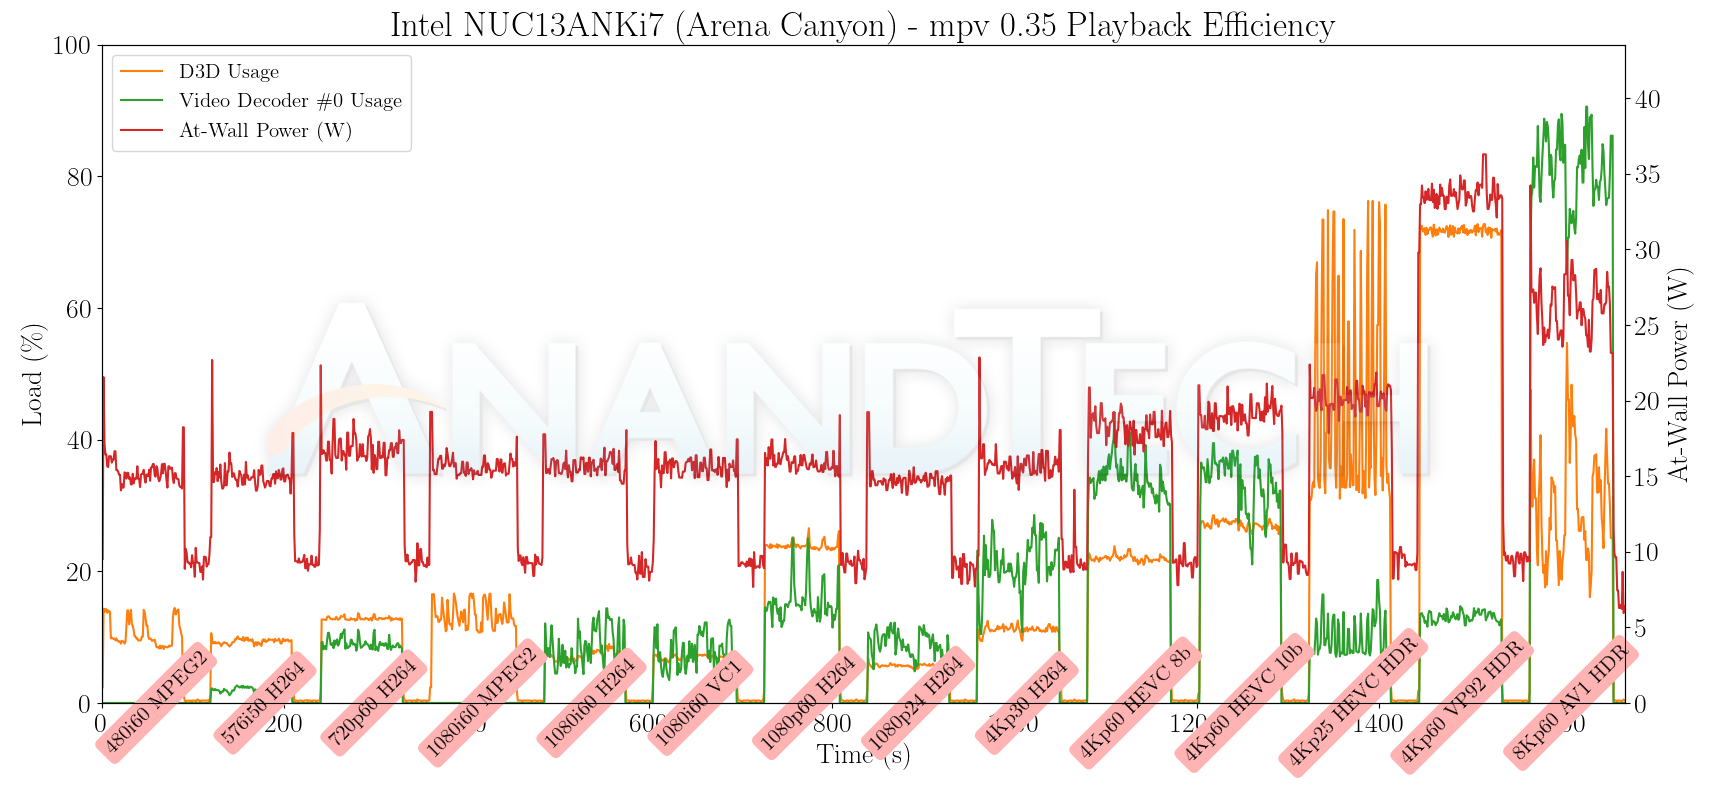
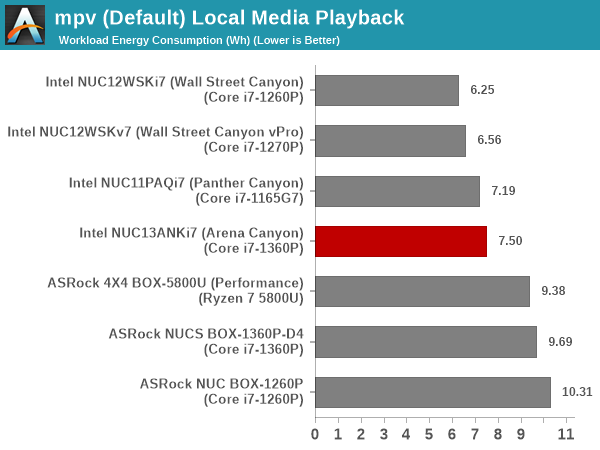
mpv playback with the gpu-next video output driver is the most energy efficient of the lot. We also have hardware accelerated decode for AV1. However, the playback for that clip still has issues, with approximately 60% of the frames getting dropped in the video output (the decoder itself doesn't drop any frames).
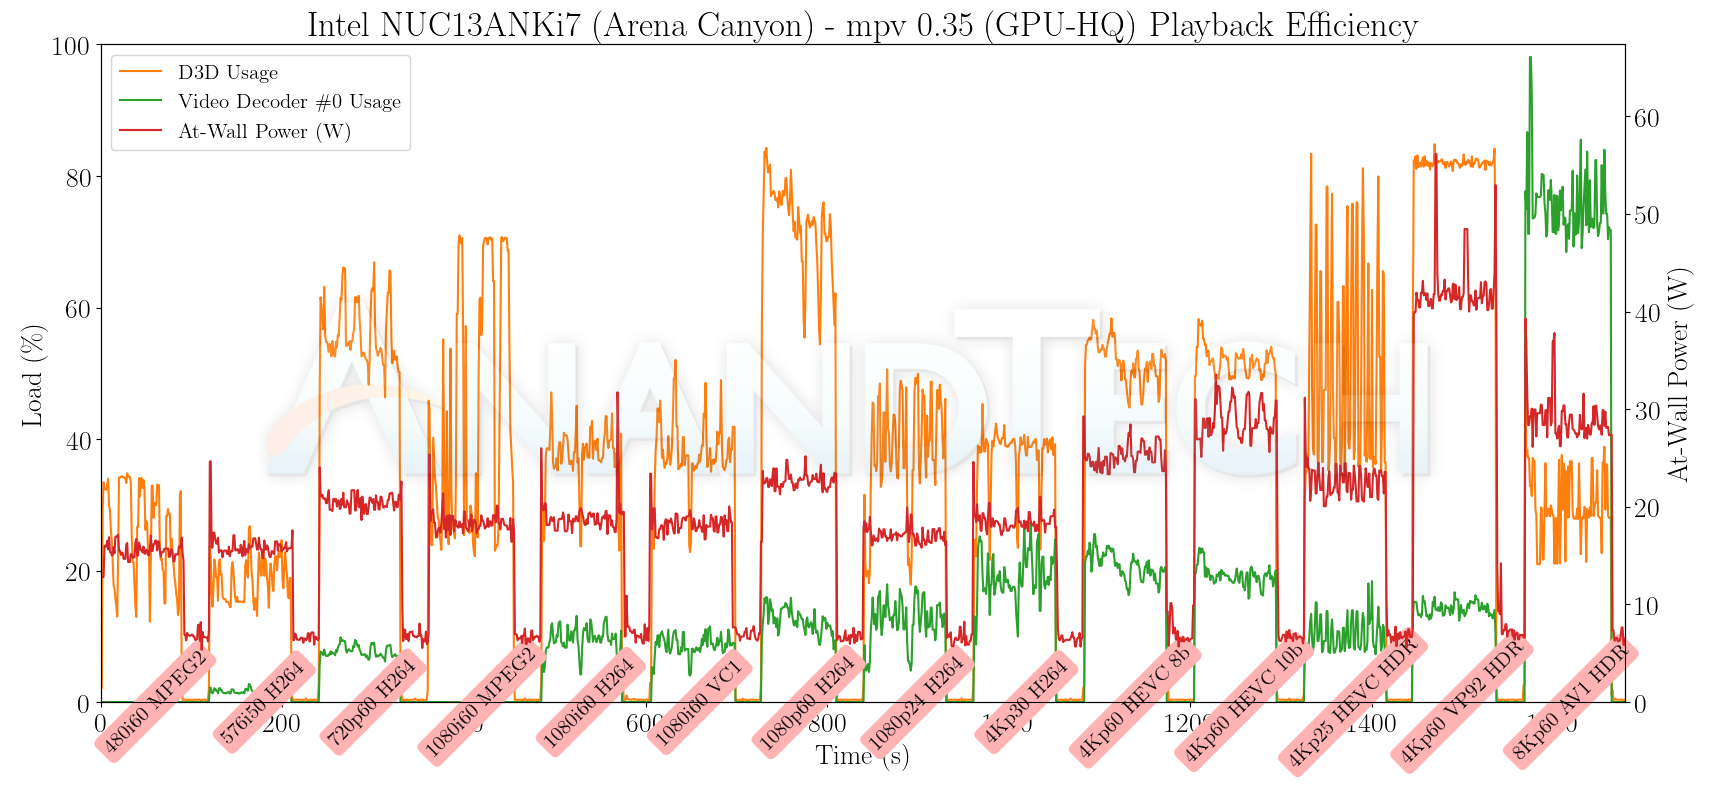
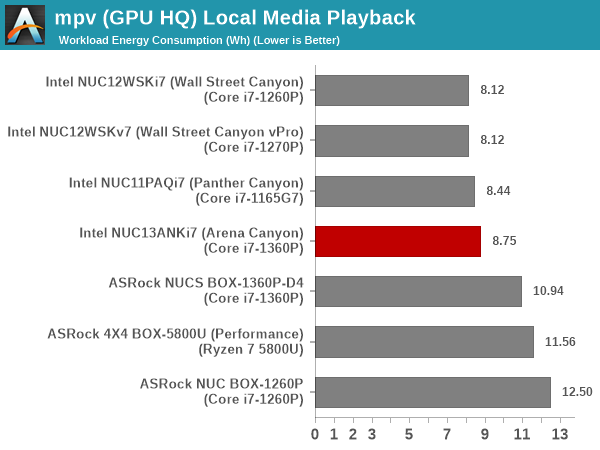
Activating the GPU shaders for video post processing does result in increased energy consumption, but there are no dropped frames. The 8Kp60 AV1 decode video output issue remains the same irrespective of the profile used.
Power Consumption and Thermal Characteristics
The power consumption at the wall was measured with a 4K display being driven through the HDMI port of the system. In the graph below, we compare the idle and load power of the Intel NUC13ANKi7 (Arena Canyon) with other systems evaluated before. For load power consumption, we ran the AIDA64 System Stability Test with various stress components, as well as our custom stress test with Prime95 / Furmark, and noted the peak as well as idling power consumption at the wall.
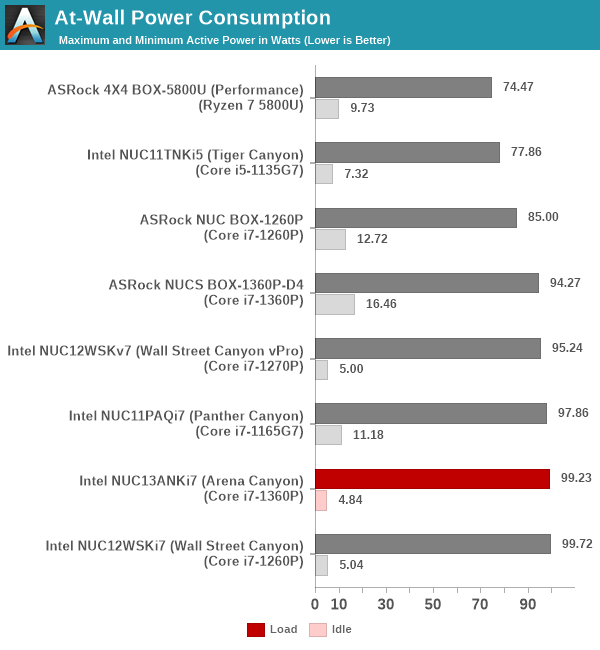
The numbers are consistent with the TDP and suggested PL1 / PL2 values for the processors in the systems, and do not come as any surprise. The load number is affected by the PL2 value (64W for the Core i7-1360P in the NUC13ANKi7). The idling numbers are excellent, with the low power state achieved by the Arena Canyon NUC matched only by the Wall Street Canyon NUCs.
Stress Testing
Our thermal stress routine is a combination of Prime95, Furmark, and Finalwire's AIDA64 System Stability Test. The following 9-step sequence is followed, starting with the system at idle:
- Start with the Prime95 stress test configured for maximum power consumption
- After 30 minutes, add Furmark GPU stress workload
- After 30 minutes, terminate the Prime95 workload
- After 30 minutes, terminate the Furmark workload and let the system idle
- After 30 minutes of idling, start the AIDA64 System Stress Test (SST) with CPU, caches, and RAM activated
- After 30 minutes, terminate the previous AIDA64 SST and start a new one with the GPU, CPU, caches, and RAM activated
- After 30 minutes, terminate the previous AIDA64 SST and start a new one with only the GPU activated
- After 30 minutes, terminate the previous AIDA64 SST and start a new one with the CPU, GPU, caches, RAM, and SSD activated
- After 30 minutes, terminate the AIDA64 SST and let the system idle for 30 minutes
Traditionally, this test used to record the clock frequencies - however, with the increasing number of cores in modern processors and fine-grained clock control, frequency information makes the graphs cluttered and doesn't contribute much to understanding the thermal performance of the system. The focus is now on the power consumption and temperature profiles to determine if throttling is in play.
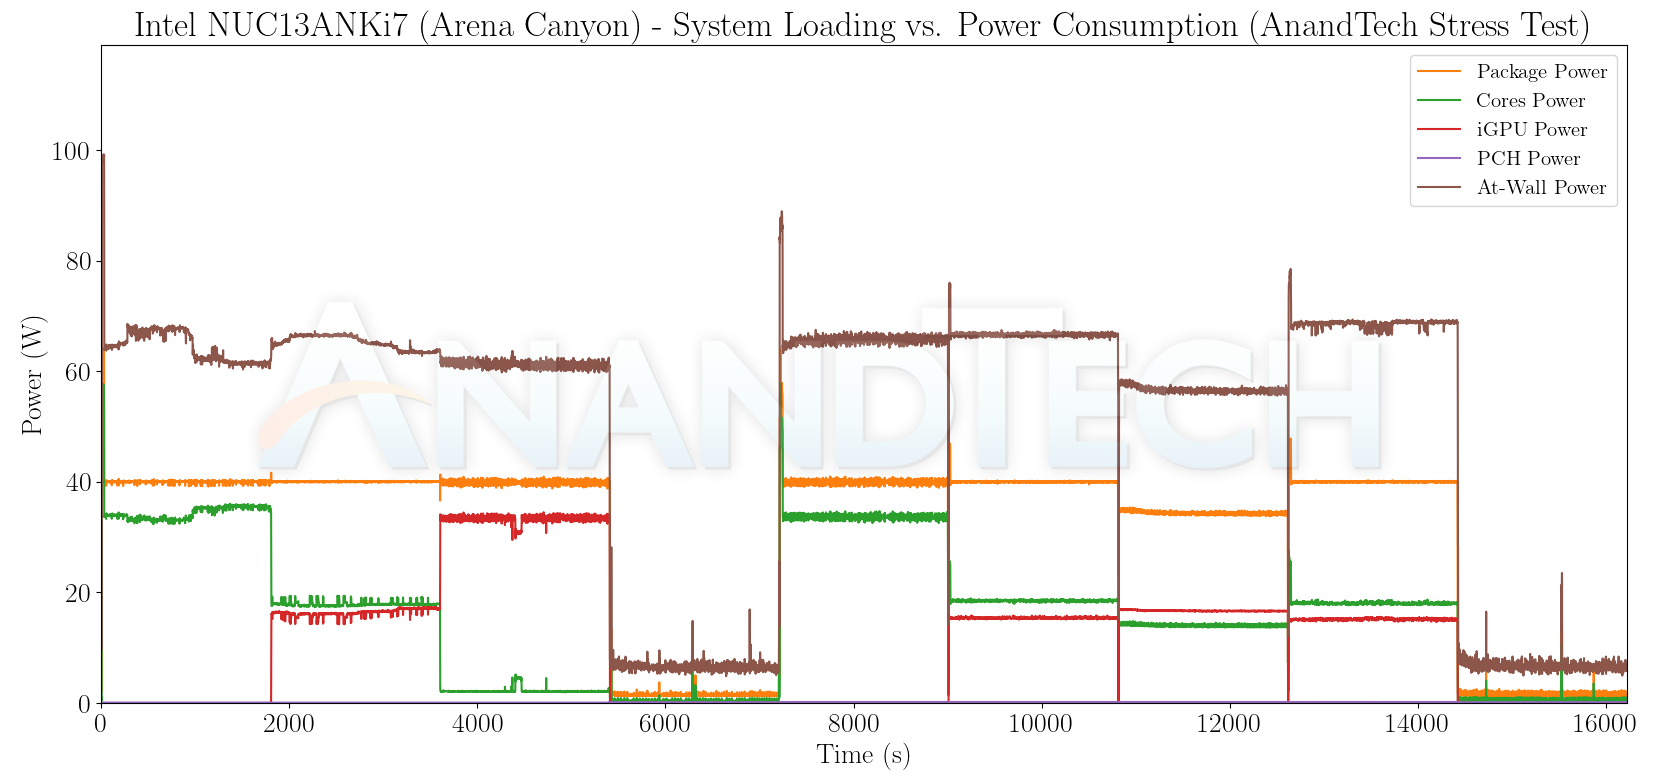
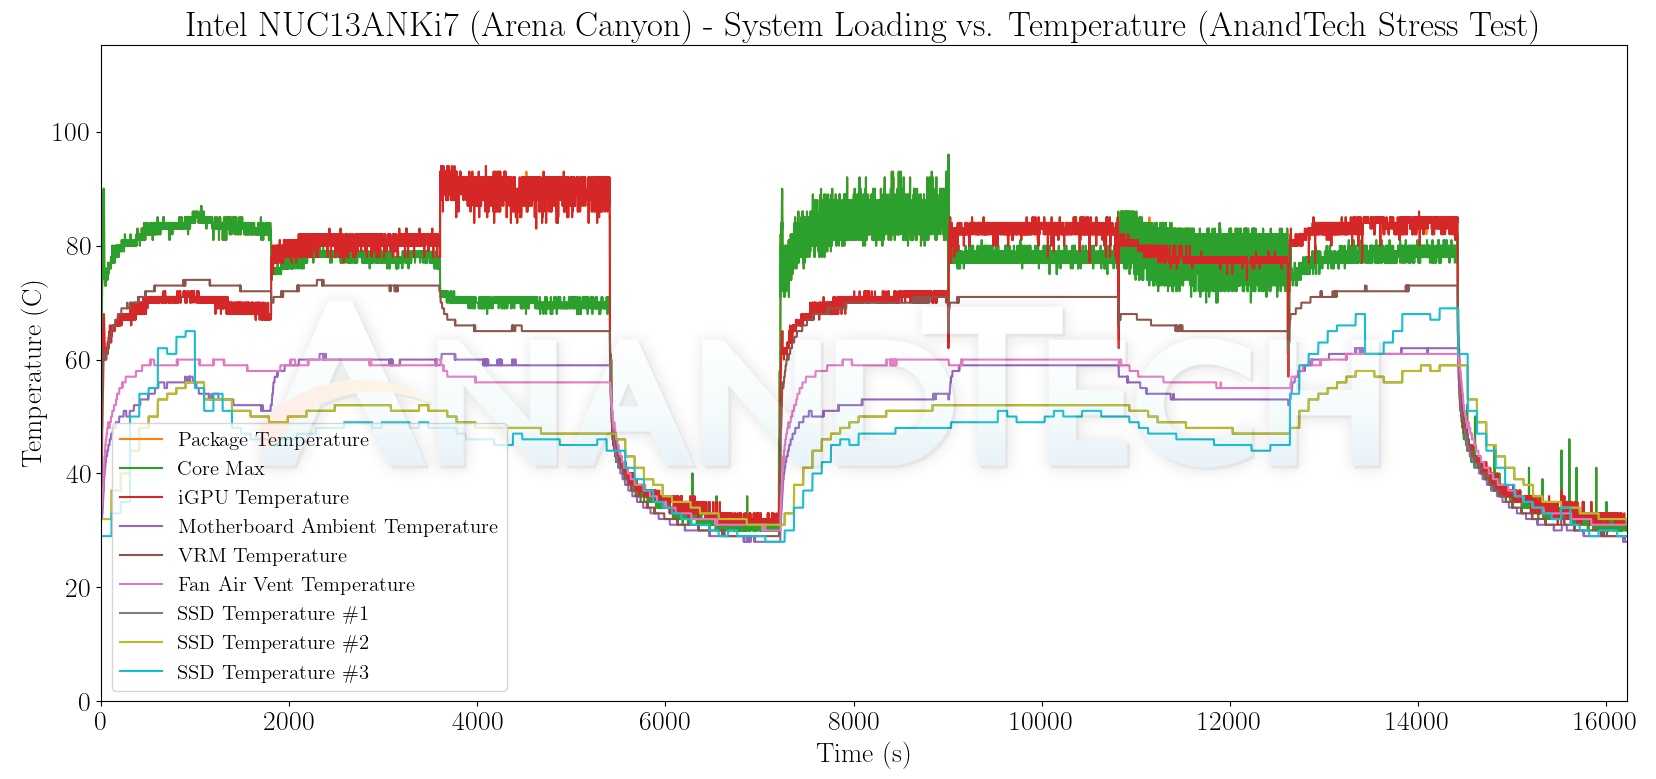
The system has no trouble maintaining a 40W package power throughout the loading period. The iGPU seems to have a maximum power budget of around 32W, with 18W being guaranteed even during high CPU load. The package temperature does reach around 92C, but never high enough for throttling to kick in. The SSD temperatures stay below 60C even when the disk is subject to stress.
Miscellaneous Aspects and Concluding Remarks
Networking and storage are aspects that may be of vital importance in specific PC use-cases. The Intel NUC13ANKi7 (Arena Canyon) comes with the Wi-Fi 6E AX211 WLAN card that also includes Bluetooth 5.3 support. On the wired front, the Intel I226-V controller backs up the 2.5 Gbps RJ-45 port. Dual LAN options are available in select Arena Canyon NUCs, but not in the specific SKU that we looked at today.
On the storage side, we have seen that UCFF PCs typically struggle with PCIe 4.0 x4 NVMe SSDs due to the lack of an effective thermal solution. We saw in the previous section that the temperature profile of the Samsung PM9A1 SSD is quite reasonable under stress. From a benchmarking perspective, we expect the SSD to deliver good scores without throttling in the WPCstorage test of SPECworkstation 3.1. This benchmark replays access traces from various programs used in different verticals and compares the score against the one obtained with a 2017 SanDisk 512GB SATA SSD in the SPECworkstation 3.1 reference system.
| SPECworkstation 3.1.0 - WPCstorage SPEC Ratio Scores | |||
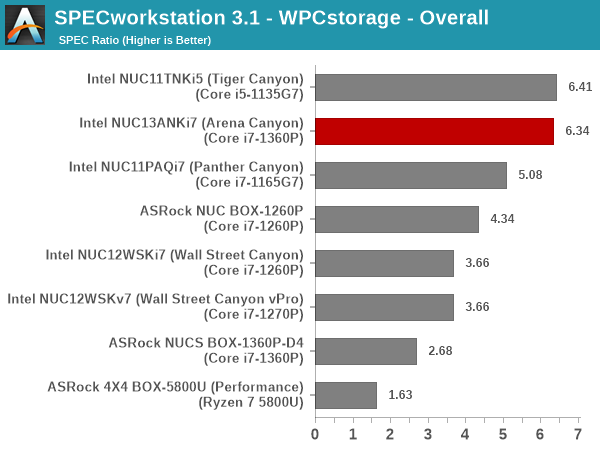
The graphs above present results for different verticals, as grouped by SPECworkstation 3.1. The storage workload consists of 60 subtests. Access traces from CFD solvers and programs such as Catia, Creo, and Solidworks come under 'Product Development'. Storage access traces from the NAMD and LAMMPS molecular dynamics simulator are under the 'Life Sciences' category. 'General Operations' includes access traces from 7-Zip and Mozilla programs. The 'Energy' category replays traces from the energy-02 SPECviewperf workload. The 'Media and Entertainment' vertical includes Handbrake, Maya, and 3dsmax. Given that the comparison is between a wide range of SSDs in the systems - including both Gen 3 and Gen 4 NVMe, the relative numbers for most workloads are not surprising. As expected, the top two spots are taken up by the Gen 4 x4 high-end Samsung PM9A1 in the Arena Canyon NUC and its direct-to-consumer equivalent (980 PRO) in the Tiger Canyon NUC. Both deliver similar numbers within permissible run-to-run variations.
Closing Thoughts
The NUC 13 Pro Arena Canyon lineup is one of Intel's most comprehensive offerings in the UCFF space for business use-cases. A decade of experience listening to customers and analyzing deployments has allowed the company to produce a system with just the right mix of hardware and software features for different domains. The NPSS software feature for digital signage applications addresses some of the pain points inherent in existing solutions. Addition of a powerful processor in the background enables these displays to bring intelligence into the mix and scale well beyond being dumb terminals.
Despite not being the first to market with a Raptor Lake-P UCFF PC, Intel has managed to make the Arena Canyon NUC stand out. The system BIOS has been optimized to increase power efficiency without sacrificing performance. The sheer number of SKUs ensure that there is a system fulfilling the targeted use-cases for every desired price point.
Intel's Raptor Lake-P is quite close to Alder Lake-P architecturally. The core counts, cache sizes, and heterogeneous combinations are pretty much equivalent. Under such circumstances, it is indeed surprising that just process advancements have enabled Raptor Lake-P to provide satisfactory improvements in performance as well as power efficiency over Alder Lake-P.

NUC 13 Pro Arena Canyon NUC (L), NUC 12 Pro Wall Street Canyon NUC (R) - Hard to Differentiate
Positives aside, it is puzzling to see Intel not taking the lead in bringing DDR5 SODIMM support into the UCFF space. The similarity of the I/Os and board features to the Wall Street Canyon NUCs is also a bit of a concern. While we do not have concrete pricing information yet, online retailer listings seem to place it in the same ballpark as that of the Wall Street Canyon NUCs. Under such conditions, it is difficult to see why anyone would prefer the NUC 12 Pro units over the NUC 13 Pro - particularly when the former is slated to be in the market for the foreseeable future. Intel could have put in some more differentiation between the two - say, allowing in-band ECC to be enabled, or more Thunderbolt 4 ports, or adding a SD card slot, or even just changing the retimers to enable USB 3.2 Gen 2x2 20 Gbps support. Those could have justified a premium and allowed the Wall Street Canyon NUCs and Arena Canyon NUCs to coexist in the market.
The wide range of SKUs, longer life-cycles, and better performance as well as energy efficiency over the previous generation are bright spots for the Arena Canyon NUC lineup. The NUC 13 Pro family comfortably delivers upon its promise, but there exists a nagging suspicion that Intel has deliberately set the bar low this time around.


